vue+antv实现雷达图的示例代码
一、下载依赖
npm install @antv/data-set
npm install @antv/g2
二、代码实现
<template>
<div ref="container" />
</template>
<script>
import DataSet from '@antv/data-set'
import { Chart } from '@antv/g2'
export default {
// 创建雷达图
mounted() {
this.constradar()
},
methods: {
constradar() {
const data = [
{ item: '工作效率', a: 70, b: 30 },
{ item: '考勤', a: 60, b: 70 },
{ item: '积极性', a: 50, b: 60 },
{ item: '帮助同事', a: 40, b: 50 },
{ item: '自主学习', a: 60, b: 70 },
{ item: '正确率', a: 70, b: 50 }
]
const { DataView } = DataSet
const dv = new DataView().source(data)
dv.transform({
type: 'fold',
fields: ['a', 'b'], // 展开字段集
key: 'user', // key字段
value: 'score' // value字段
})
const chart = new Chart({
container: this.$refs.container,
autoFit: true,
height: 500
})
chart.data(dv.rows)
chart.scale('score', {
min: 0,
max: 80
})
chart.coordinate('polar', {
radius: 0.8
})
chart.tooltip({
shared: true,
showCrosshairs: true,
crosshairs: {
line: {
style: {
lineDash: [4, 4],
stroke: '#333'
}
}
}
})
chart.axis('item', {
line: null,
tickLine: null,
grid: {
line: {
style: {
lineDash: null
}
}
}
})
chart.axis('score', {
line: null,
tickLine: null,
grid: {
line: {
type: 'line',
style: {
lineDash: null
}
}
}
})
chart.line().position('item*score').color('user').size(2)
chart
.point()
.position('item*score')
.color('user')
.shape('circle')
.size(4)
.style({
stroke: '#fff',
lineWidth: 1,
fillOpacity: 1
})
chart.area().position('item*score').color('user')
chart.render()
//修改数据
const newData = [
{ item: '工作效率', a: 20, b: 30 },
{ item: '考勤', a: 30, b: 70 },
{ item: '积极性', a: 10, b: 60 },
{ item: '帮助同事', a: 40, b: 50 },
{ item: '自主学习', a: 60, b: 70 },
{ item: '正确率', a: 20, b: 50 }
]
// 立刻更新
setTimeout(() => {
// 处理数据开始
const dv = new DataView().source(newData)
dv.transform({
type: 'fold',
fields: ['a', 'b'], // 展开字段集
key: 'user', // key字段
value: 'score' // value字段
})
// 处理结束
// 正式使用处理之后的数据进行图标更新
chart.changeData(dv.rows)
}, 3000)
}
}
}
</script>
<style></style>
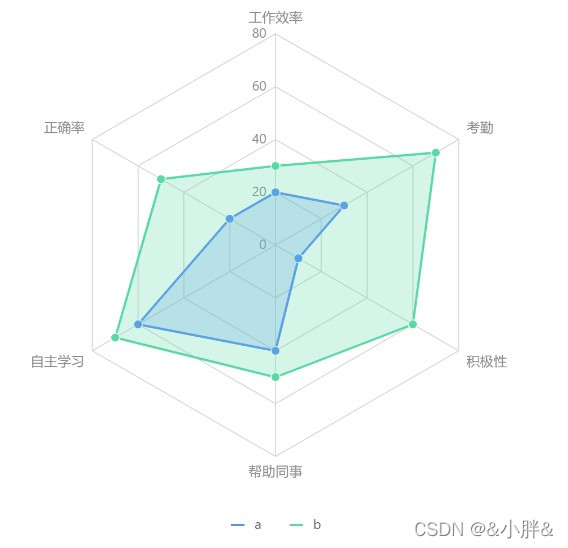
三、实现效果
数据修改前
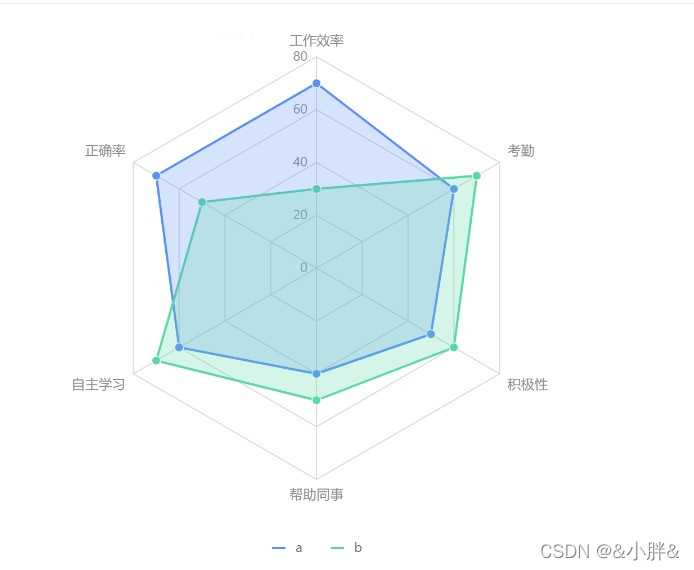
数据修改后
到此这篇关于vue+antv实现雷达图的文章就介绍到这了,更多相关vue雷达图内容请搜索以前的文章或继续浏览下面的相关文章希望大家以后多多支持!
以上是 vue+antv实现雷达图的示例代码 的全部内容, 来源链接: utcz.com/p/240250.html