详解prometheus监控golang服务实践记录
一、prometheus基本原理介绍
prometheus是基于metric采样的监控,可以自定义监控指标,如:服务每秒请求数、请求失败数、请求执行时间等,每经过一个时间间隔,数据都会从运行的服务中流出,存储到一个时间序列数据库中,之后可通过PromQL语法查询。
主要特点:
多维数据模型,时间序列数据通过metric名以key、value的形式标识;
使用PromQL语法灵活地查询数据;
不需要依赖分布式存储,各服务器节点是独立自治的;
时间序列的收集,通过 HTTP 调用,基于pull 模型进行拉取;
通过push gateway推送时间序列;
通过服务发现或者静态配置,来发现目标服务对象;
多种绘图和仪表盘的可视化支持;
二、prometheus使用docker部署
查看是否有镜像
sudo docker search prometheus
新建prometheus.yaml
global:
scrape_interval: 10s
evaluation_interval: 60s
scrape_configs:
- job_name: prometheus
static_configs:
- targets: ['localhost:9090']
- job_name: integral
static_configs:
- targets: ['10.20.xx.xx:8001']
执行:
docker run --name prometheus -p 9090:9090 -v ~/prometheus.yaml:/etc/prometheus/prometheus.yml prom/prometheus
进入容器中可以看到配置文件已映射到容器指定目录:
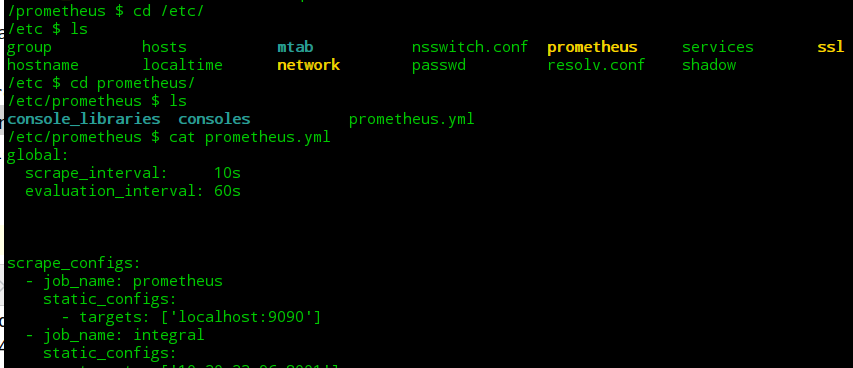
踩坑: prometheus官方镜像指定的配置文件是prometheus.yml 所以映射到容器内的文件名一定要保持一致 否则会出现指定的配置文件不生效
三、prometheus整体架构及各组件
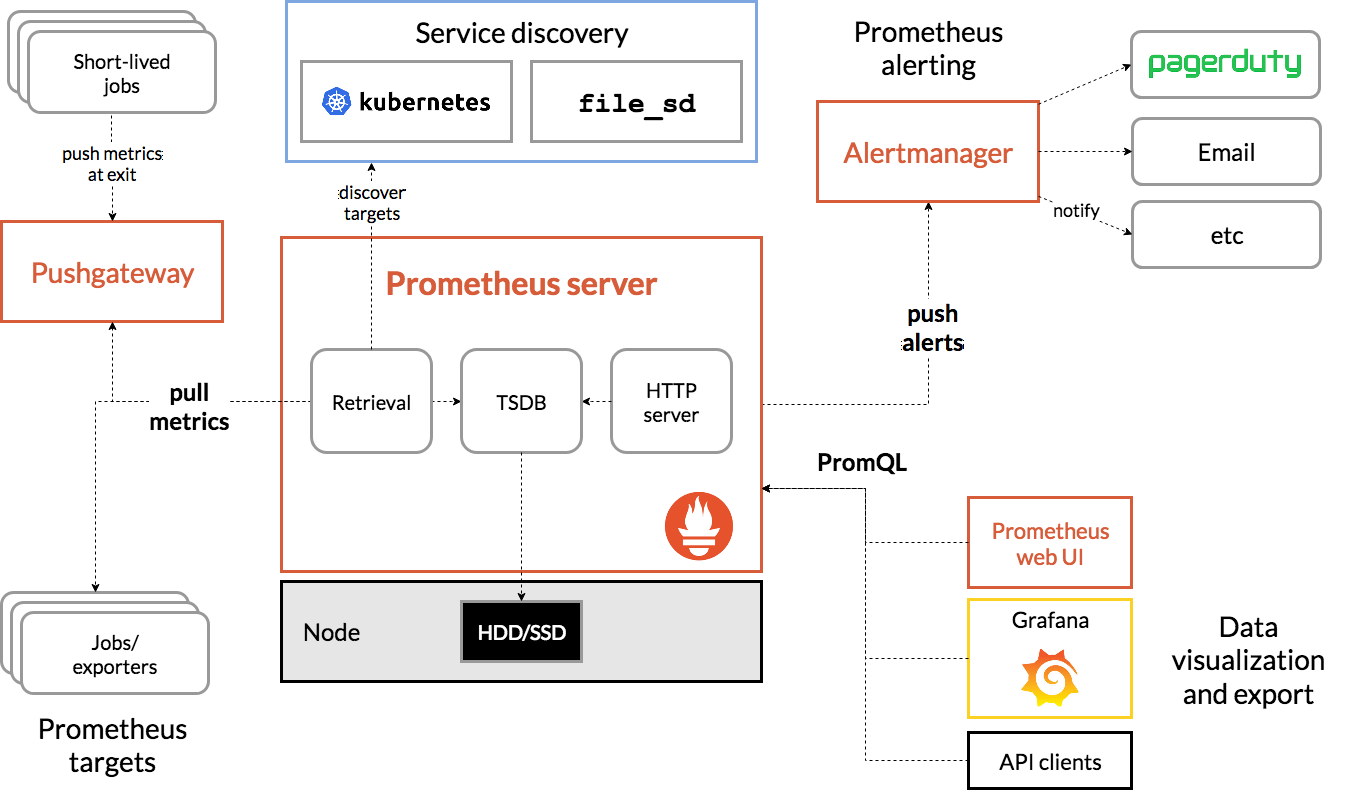
Prometheus Server :主程序,负责抓取和存储时序数据;
Client Libraries:客户端库,负责检测应用程序代码;
Push Gateway:Push 网关,接收短生命周期的 Job 主动推送的时序数据;
Exporters:为不同服务定制的Exporter(如:HAProxy、StatsD、Graphite等) ,从而抓取它们的Metris指标数据;
Alert Manage:告警管理器,处理不同的告警;
四、prometheus客户端调用示例
自定义prometheus的gin中间件
package ginprometheus
import (
"strconv"
"sync"
"time"
"github.com/gin-gonic/gin"
"github.com/prometheus/client_golang/prometheus"
)
const (
metricsPath = "/metrics"
faviconPath = "/favicon.ico"
)
var (
// httpHistogram prometheus 模型
httpHistogram = prometheus.NewHistogramVec(prometheus.HistogramOpts{
Namespace: "http_server",
Subsystem: "",
Name: "requests_seconds",
Help: "Histogram of response latency (seconds) of http handlers.",
ConstLabels: nil,
Buckets: nil,
}, []string{"method", "code", "uri"})
)
// init 初始化prometheus模型
func init() {
prometheus.MustRegister(httpHistogram)
}
// handlerPath 定义采样路由struct
type handlerPath struct {
sync.Map
}
// get 获取path
func (hp *handlerPath) get(handler string) string {
v, ok := hp.Load(handler)
if !ok {
return ""
}
return v.(string)
}
// set 保存path到sync.Map
func (hp *handlerPath) set(ri gin.RouteInfo) {
hp.Store(ri.Handler, ri.Path)
}
// GinPrometheus gin调用Prometheus的struct
type GinPrometheus struct {
engine *gin.Engine
ignored map[string]bool
pathMap *handlerPath
updated bool
}
type Option func(*GinPrometheus)
// Ignore 添加忽略的路径
func Ignore(path ...string) Option {
return func(gp *GinPrometheus) {
for _, p := range path {
gp.ignored[p] = true
}
}
}
// New new gin prometheus
func New(e *gin.Engine, options ...Option) *GinPrometheus {
if e == nil {
return nil
}
gp := &GinPrometheus{
engine: e,
ignored: map[string]bool{
metricsPath: true,
faviconPath: true,
},
pathMap: &handlerPath{},
}
for _, o := range options {
o(gp)
}
return gp
}
// updatePath 更新path
func (gp *GinPrometheus) updatePath() {
gp.updated = true
for _, ri := range gp.engine.Routes() {
gp.pathMap.set(ri)
}
}
// Middleware set gin middleware
func (gp *GinPrometheus) Middleware() gin.HandlerFunc {
return func(c *gin.Context) {
if !gp.updated {
gp.updatePath()
}
// 过滤请求
if gp.ignored[c.Request.URL.String()] {
c.Next()
return
}
start := time.Now()
c.Next()
httpHistogram.WithLabelValues(
c.Request.Method,
strconv.Itoa(c.Writer.Status()),
gp.pathMap.get(c.HandlerName()),
).Observe(time.Since(start).Seconds())
}
}
gin路由初始化prometheus,使用中间件采样
gp := ginprometheus.New(r)
r.Use(gp.Middleware())
// metrics采样
r.GET("/metrics", gin.WrapH(promhttp.Handler()))
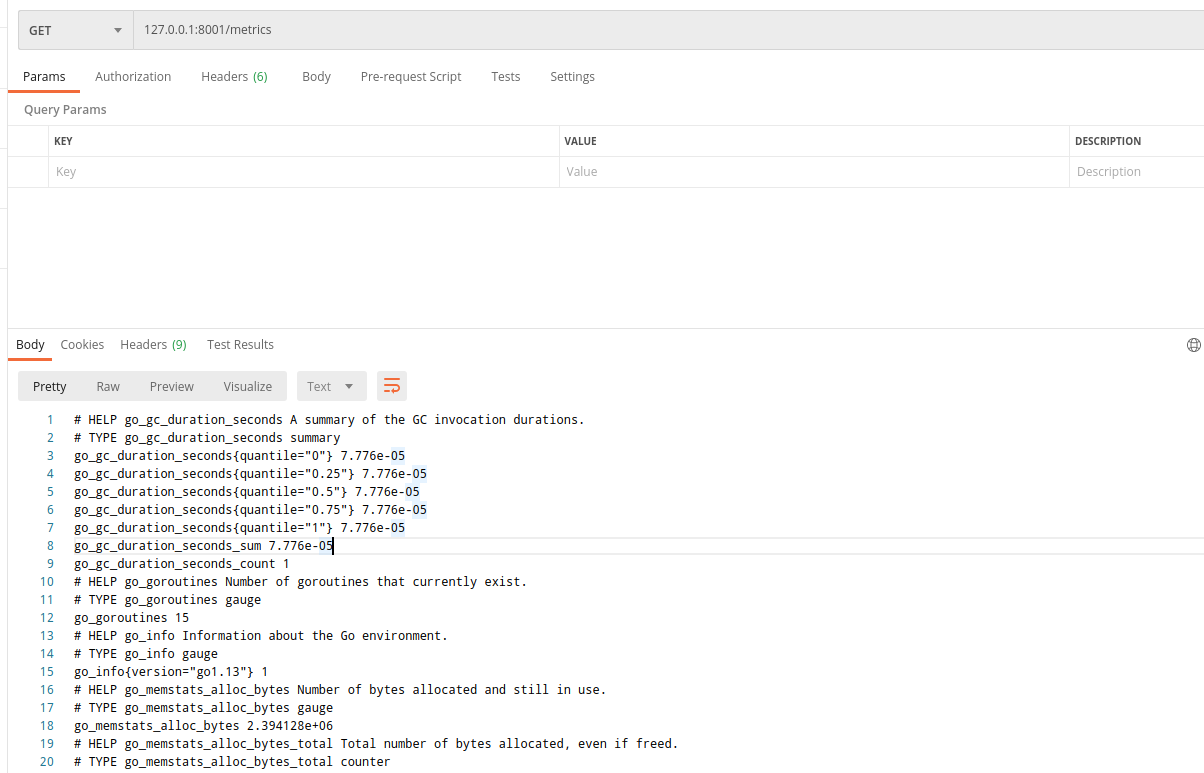
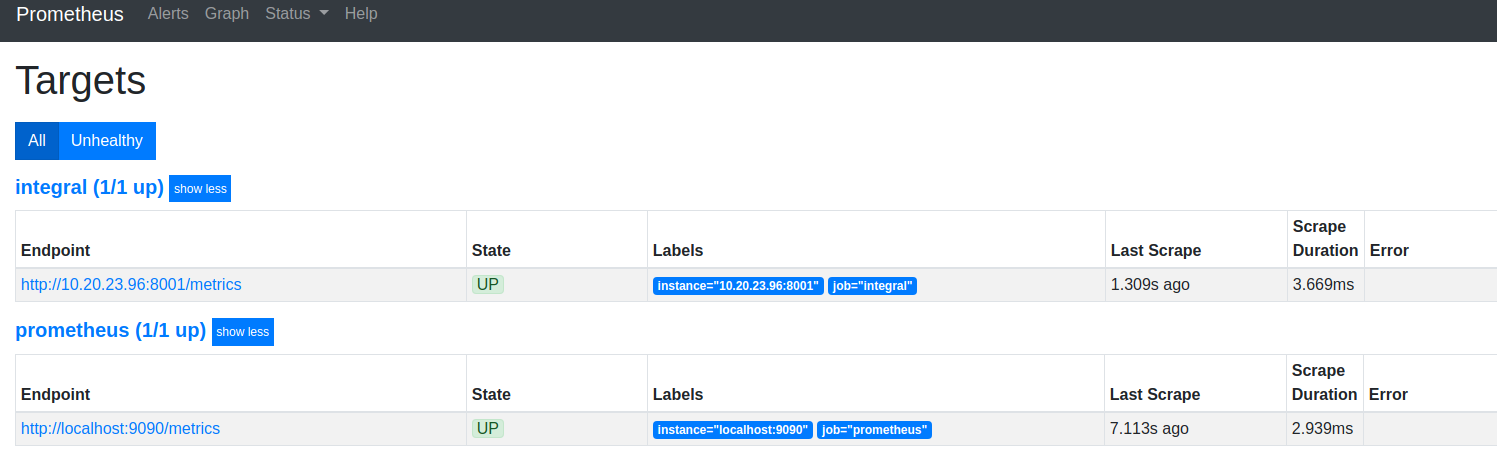
查看target
选取指标对应的graph,这里以gc采样的时间为例:
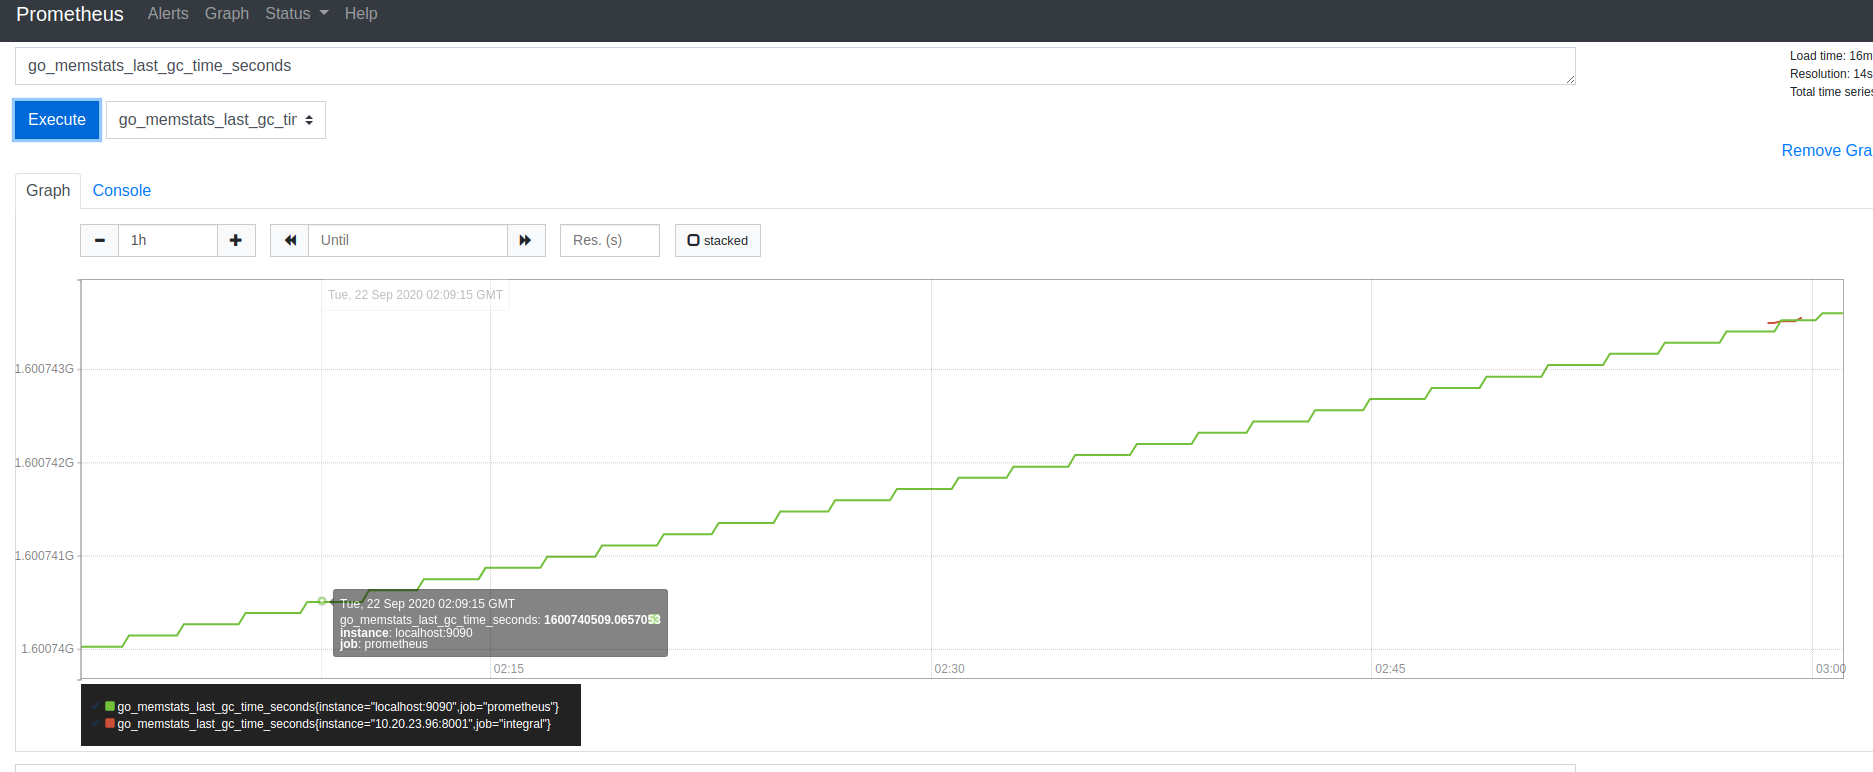
如果需要展示更为丰富的可视化看板,可以将prometheus与grafana结合,将prometheus数据接入到grafana中,此处不再过多阐述
到此这篇关于详解prometheus监控golang服务实践记录的文章就介绍到这了,更多相关prometheus监控golang服务内容请搜索以前的文章或继续浏览下面的相关文章希望大家以后多多支持!
以上是 详解prometheus监控golang服务实践记录 的全部内容, 来源链接: utcz.com/p/235656.html