JavaScript使用canvas绘制坐标和线
本文实例为大家分享了JavaScript使用canvas绘制坐标和线的具体代码,供大家参考,具体内容如下
具体代码如下:
<!DOCTYPE html>
<html lang="en">
<head>
<meta charset="UTF-8">
<title>在指定位置画多个点</title>
<style>
canvas{
border: 1px dashed gray;
}
</style>
</head>
<body>
<canvas id="cvs" width="500" height="500"></canvas>
</body>
</html>
js代码:
<script>
var cvs = document.getElementById('cvs');
var ctx = cvs.getContext('2d');
// 坐标轴距离画布上右下左的边距
var padding = {
top:20,
right:20,
bottom:20,
left:20
}
// 坐标轴中箭头的宽和高
var arrow = {
width:12,
height:20
}
// 求坐标轴上顶点的坐标
var vertexTop = {
x:padding.left,
y:padding.top
}
// 求坐标轴原点的坐标
var origin = {
x:padding.left,
y:cvs.height - padding.bottom
}
// 求坐标轴右顶点的坐标
var vertexRight = {
x:cvs.width - padding.left,
y:cvs.height - padding.bottom
}
//设置线宽
ctx.lineWidth = 2;
//画坐标轴的两条线
ctx.beginPath();
ctx.moveTo(vertexTop.x,vertexTop.y);
ctx.lineTo(origin.x,origin.y);
ctx.lineTo(vertexRight.x,vertexRight.y);
ctx.stroke();
//如何画箭头
//画顶上箭头
// ^
// |
// |
ctx.beginPath();
ctx.moveTo(vertexTop.x,vertexTop.y);
ctx.lineTo(vertexTop.x - arrow.width/2,vertexTop.y + arrow.height);
ctx.lineTo(vertexTop.x,vertexTop.y + arrow.height/2);
ctx.lineTo(vertexTop.x + arrow.width/2,vertexTop.y + arrow.height);
ctx.fill();
//画右边的箭头
// --->
ctx.beginPath();
ctx.moveTo(vertexRight.x,vertexRight.y);
ctx.lineTo(vertexRight.x - arrow.height,vertexRight.y - arrow.width);
ctx.lineTo(vertexRight.x - arrow.height/2,vertexRight.y);
ctx.lineTo(vertexRight.x - arrow.height,vertexRight.y + arrow.width);
ctx.fill();
/*
* 在坐标轴中指定位置画点,坐标算法:
* 点的x轴:原点x坐标 + 点到原点的水平距离
* 点的y轴:原点y坐标 - 点到原点的垂直距离
*/
//定义点的坐标
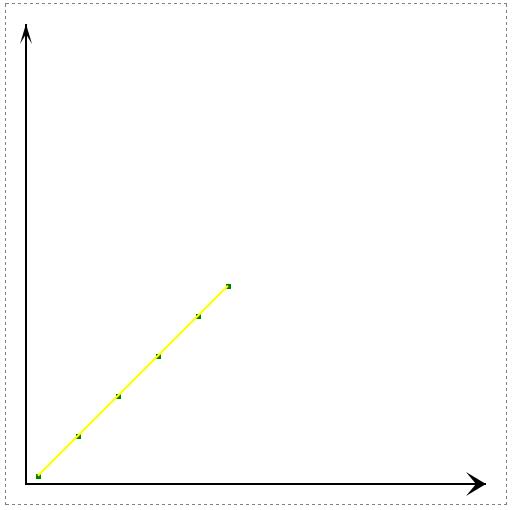
var points = [[10,10],[50,50],[90,90],[130,130],[170,170],[200,200]];
//在坐标中画点 使用循环遍历数组中的坐标
//设置颜色
ctx.fillStyle = "green";
points.forEach(function(arr){
ctx.fillRect(origin.x + arr[0],origin.y - arr[1],5,5);
});
//根据点连线
//防止重绘
ctx.beginPath();
ctx.lineWidth = 2;
ctx.strokeStyle = "yellow";
points.forEach(function (arr) {
ctx.lineTo(origin.x + arr[0] + 1.8,origin.y - arr[1] + 1.8);
});
//描边
ctx.stroke();
</script>
效果如下:
以上就是本文的全部内容,希望对大家的学习有所帮助,也希望大家多多支持。
以上是 JavaScript使用canvas绘制坐标和线 的全部内容, 来源链接: utcz.com/p/220194.html