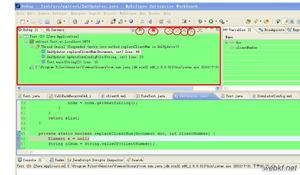
Eclipse怎堪看完整的堆栈信息

怎么看完整的堆栈信息呢?就是...27more后面的内容。
回答:
最下的异常的最后一行和前面一个的第一行结合起来就是完成的堆栈信息。
原因:
这些异常信息是通过Throwable.printStackTrace()输出到System.err,先引用JDK官方文档的一段描述
HighLevelException: MidLevelException: LowLevelException at Junk.a(Junk.java:13)
at Junk.main(Junk.java:4)
Caused by: MidLevelException: LowLevelException
at Junk.c(Junk.java:23)
at Junk.b(Junk.java:17)
at Junk.a(Junk.java:11)
... 1 more
Caused by: LowLevelException
at Junk.e(Junk.java:30)
at Junk.d(Junk.java:27)
at Junk.c(Junk.java:21)
... 3 more
Note the presence of lines containing the characters "...". These lines indicate that the remainder of the stack trace for this exception matches the indicated number of frames from the bottom of the stack trace of the exception that was caused by this exception (the "enclosing" exception).
这些行指示此异常的椎栈跟踪的其余部分匹配来自异常(由 "enclosing" 异常引起)的堆栈跟踪底部的指定数量的帧
也可以这样理解,方法之间的调用都是栈模型,比如a.b.c表示a方法调用b方法,b方法调用c方法。那么在c方法中抛出的异常只表示c方法栈帧中的信息,b方法抛出异常会有b和c两个栈帧的信息,如此网上递推。
以上是 Eclipse怎堪看完整的堆栈信息 的全部内容, 来源链接: utcz.com/p/173806.html