D3.js实现带伸缩时间轴拓扑图的代码示例
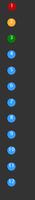
效果图:

基于d3-v5, 依赖dagre-d3, 直接上代码:
<!DOCTYPE html><html lang="en">
<head>
<meta charset="UTF-8">
<meta name="viewport" content="width=device-width, initial-scale=1.0">
<meta http-equiv="X-UA-Compatible" content="ie=edge">
<title>Document</title>
<style>
svg {
border: 1px solid darkcyan;
}
/* 拓扑图--start */
/* 节点状态颜色 */
g.type-current>circle {
fill: #FFAC27;
}
g.type-success>circle {
fill: #9270CA;
}
g.type-fail>circle {
fill: #67C23A;
}
g.type-done>circle {
fill: #E8684A;
}
/* 拓扑图--end */
/* 坐标轴-start */
.axis path,
.axis line {
fill: none;
stroke: #DCDCDC;
shape-rendering: crispEdges;
}
.axis text {
font-family: sans-serif;
font-size: 12px;
fill: #999999;
}
.axis .x2-axis text {
font-size: 14px;
font-weight: 400;
fill: #333;
}
.axis .x2-axis .tick {
stroke-width: 2px;
}
/* 坐标轴-end */
</style>
</head>
<script src=" http://d3js.org/d3.v5.min.js "></script>
<script src="https://cdn.bootcss.com/dagre-d3/0.6.3/dagre-d3.js"></script>
<body>
</body>
<script>
let nodeInfo = [{
id: 0,
label: "",
status: 'success',
date: 1575129600000
}, {
id: 1,
label: "",
status: 'fail',
date: 1578376890000
}, {
id: 2,
label: '',
status: 'success',
date: 1578376890000
}, {
id: 3,
label: '',
status: 'fail',
date: 1578895290000
}, {
id: 4,
label: '',
status: 'current',
date: 1578895290000
}, {
id: 5,
label: '',
status: 'done',
date: 1579327290000
}, {
id: 6,
label: '',
status: 'done',
date: 1579932090000
}, {
id: 7,
label: '',
status: 'done',
date: 1581487290000
}, {
id: 8,
label: '',
status: 'success',
date: 1583461994000
}]
let lineInfo = [
{ from: 0, to: 1 },
{ from: 0, to: 2 },
{ from: 0, to: 3 },
{ from: 2, to: 4 },
{ from: 2, to: 5 },
{ from: 3, to: 6 },
{ from: 6, to: 7 },
{ from: 6, to: 8 },
]
let nodeMap = new Map() //节点信息map
let nodeDomMap = new Map() //节点dom--map
let timeArr = [] //存储时间
const width = 1200
const height = 400
const padding = { top: 0, bottom: 40, left: 40, right: 40 }
// 节点信息转化为map
nodeInfo.forEach(item => {
nodeMap.set(item.id, item);
timeArr.push(item.date)
})
let max = new Date(d3.max(timeArr))
let min = new Date(d3.min(timeArr))
maxY = max.getFullYear()
maxM = max.getMonth()
minY = min.getFullYear()
minM = min.getMonth()
// 创建画布 svg
let svg = d3.select("body").append("svg")
.attr("id", "svg-canvas")
.attr("preserveAspectRatio", "xMidYMid meet")
.attr("viewBox", `0 0 ${width} ${height}`)
// 初始化元素
let background = svg.append("rect").attr("class", "bg")
let view = svg.append("g").attr("class", "view")
let grid = svg.append("g").attr("class", "grid")
let axis = svg.append("g").attr("class", "axis")
let separateLine = svg.append("line").attr("class", "separate-line")
// 绘制箭头以供引用
d3.select("#svg-canvas").append("defs").append("marker")
.attr("id", "triangle").attr("viewBox", "0 0 10 10")
.attr("refX", "17").attr("refY", "5")
.attr("markerWidth", "6").attr("markerHeight", "6")
.attr("orient", "auto").append("path")
.attr("d", "M 0 0 L 10 5 L 0 10 z").style("fill", "#bbbbbb")
// 添加背景板 rect
background.attr("fill", "#FAFAFA")
.attr("x", 0).attr("y", 0)
.attr("width", width).attr("height", height - padding.bottom)
const monthNum = d3.timeMonth.count(min, max) // 区间月份数量
// 确定比例尺
let xScale = d3.scaleTime()
.domain([new Date(minY, minM, 1), new Date(maxY, ++maxM, 1)])
.range([0, width - padding.left - padding.right])
// 坐标轴文本格式化
let formatDay = d3.axisBottom(xScale).tickFormat((d, i) => {
const date = new Date(d)
const day = date.getDate()
return `${day === 1 ? "" : day}` // 如果是1号, 不显示刻度,直接由xAxis2显示年月
})
let formatMonth = d3.axisBottom(xScale).ticks(d3.timeMonth.every(1)).tickPadding(6).tickSizeInner(20).tickFormat((d, i) => {
const date = new Date(d)
const mon = date.getMonth() + 1
const year = date.getFullYear()
return `${year} - ${mon > 9 ? mon : "0" + mon}`
})
axis.attr('transform', `translate(${padding.left},${height - padding.bottom})`)
let xAxisDay = axis.append("g")
.attr("class", "x-axis").call(formatDay)
let xAxisMonth = axis.append("g")
.attr("class", "x2-axis").call(formatMonth)
// 绘制x网格
const lineGroup = grid.attr("transform", `translate(${padding.left},0)`)
.selectAll("g")
.data(xScale.ticks(monthNum))
.enter().append("g")
lineGroup.append("line")
.attr("x1", d => { return xScale(new Date(d)) })
.attr("x2", d => { return xScale(new Date(d)) })
.attr("y1", padding.top)
.attr("y2", height - padding.bottom)
.attr("class", "grid-line")
.style("stroke", "#DCDCDC")
.style("stroke-dasharray", 6)
// 添加坐标轴与拓扑图分隔线
separateLine.style("stroke", "#DCDCDC")
.style("stroke-width", 2)
.attr("x1", 0)
.attr("x2", width)
.attr("y1", height - padding.bottom)
.attr("y2", height - padding.bottom)
// 绘制流程图 节点--箭头
let g = new dagreD3.graphlib.Graph()
.setGraph({})
.setDefaultEdgeLabel(function () { return {}; });
g.graph().rankdir = "LR"; // 控制水平显示
g.graph().marginx = 0;
g.graph().marginy = 50;
nodeInfo && nodeInfo.map((item, i) => {
g.setNode(item.id, {
label: item.label,
class: "type-" + item.status,
style: "stroke-width: 2px; stroke: #fff",
shape: "circle",
id: item.id
});
})
lineInfo && lineInfo.map((item, i) => {
g.setEdge(item.from, item.to,
{
arrowheadStyle: "stroke:none; fill: none", // 箭头头部样式
style: "stroke:none; fill: none" //线条样式
})
})
let render = new dagreD3.render();
render(view.attr("transform", `translate(${padding.left},0)`), g);
// 重新定位节点x坐标
const nodesArr = d3.select(".nodes").selectAll(".node")._groups[0]
nodesArr.forEach((item) => {
let dom = d3.select(item)._groups[0][0]
let id = Number(dom.id)
let date = nodeMap.get(id).date
const x = xScale(new Date(date));
const y = dom.transform.animVal[0].matrix.f
d3.select(item).attr("transform", `translate(${x},${y})`)
nodeDomMap.set(Number(item.id), item)
})
// 重新绘制箭头
lineInfo && lineInfo.map((item, i) => {
let fromDom = nodeDomMap.get(Number(item.from))
let toDom = nodeDomMap.get(Number(item.to))
const [x1, y1, x2, y2] = [
fromDom.transform.animVal[0].matrix.e,
fromDom.transform.animVal[0].matrix.f,
toDom.transform.animVal[0].matrix.e,
toDom.transform.animVal[0].matrix.f,
]
d3.select(".edgePaths").append("g")
.append("line")
.attr("class", `to-${item.to}`) // 设置唯一的class方便修改路径
.attr("stroke-width", "2")
.attr("stroke", "#bbbbbb")
.style("stroke-dasharray", 8)
.attr("marker-end", "url(#triangle)")
.attr("x1", x1).attr("y1", y1)
.attr("x2", x2).attr("y2", y2)
})
// 设置zoom参数
let zoom = d3.zoom()
.scaleExtent([1, 10])
.translateExtent([[0, 0], [width, height]]) //移动的范围
.extent([[0, 0], [width, height]])//视窗 (左上方,右下方)
svg.call(zoom.on("zoom", reRender.bind(this)));
// 每次缩放重定位渲染拓扑图
function reRender() {
const t = d3.event.transform.rescaleX(xScale) //获得缩放后的比例尺
xAxisDay.call(formatDay.scale(t)) //重新设置x坐标轴的scale
xAxisMonth.call(formatMonth.scale(t)) //重新设置x坐标轴的scale
const view = d3.select(".output")
const axis = d3.select(".axis-month")
const grid = d3.selectAll(".grid-line")
// 重新绘制节点
nodesArr.forEach((item) => {
let dom = d3.select(item)._groups[0][0]
let id = Number(dom.id)
let date = nodeMap.get(id).date
const x = t(new Date(date));
const y = dom.transform.animVal[0].matrix.f
d3.select(item).attr("transform", `translate(${x},${y})`)
nodeDomMap.set(Number(item.id), item)
})
// 重新绘制箭头
lineInfo && lineInfo.map((item, i) => {
let fromDom = nodeDomMap.get(Number(item.from))
let toDom = nodeDomMap.get(Number(item.to))
const [x1, y1, x2, y2] = [
fromDom.transform.animVal[0].matrix.e,
fromDom.transform.animVal[0].matrix.f,
toDom.transform.animVal[0].matrix.e,
toDom.transform.animVal[0].matrix.f,
]
d3.select(`.to-${item.to}`)
.attr("x1", x1).attr("y1", y1)
.attr("x2", x2).attr("y2", y2)
})
//重新绘制x网格
svg.selectAll(".grid-line")
.attr("x1", d => { return t(new Date(d)) })
.attr("x2", d => { return t(new Date(d)) })
}
</script>
</html>
以上就是D3.js实现带伸缩时间轴拓扑图的代码示例的全部内容,希望对大家的学习有所帮助。
以上是 D3.js实现带伸缩时间轴拓扑图的代码示例 的全部内容, 来源链接: utcz.com/a/7446.html