在Vue和React中使用ECharts的多种方法
前言
俗话说:“工欲善其事,必先利其器”。现如今已经有许多成熟易用的可视化解决方案,例如ECharts,AntV等等。我们可以把这些解决方案比作是一套套成熟的“工具”,那我们如何将这些“工具”应用于当前最热门的两个前端框架中呢?
不慌,现在我们就以ECharts为例,来尝试“工具”的各种用法。
Vue中运用ECharts
首先我们要把ECharts下载下来:
npm install echarts --save全局引用
全局引用的好处就是我们一次性把ECharts引入项目后,就可以在任何一个组件中使用ECharts了。
首先在项目的main.js中引入ECharts,然后将其绑定在vue的原型上面:
import echarts from 'echarts'Vue.prototype.$echarts = echarts
接下来我们就可以在自己想用ECharts的组件中引用了:
<template><div>
<div id="myChart"></div>
</div>
</template>
<script>
export default{
name: 'chart',
data () {
return {
chart: null,
options: {}
}
},
mounted () {
this.initOptions()
this.initCharts()
},
methods: {
initOptions () {
this.options = {
xAxis: {
type: 'category',
data: ['Mon', 'Tue', 'Wed', 'Thu', 'Fri', 'Sat', 'Sun']
},
yAxis: {
type: 'value'
},
series: [{
data: [820, 932, 901, 934, 1290, 1330, 1320],
type: 'line'
}]
}
},
initCharts () {
this.chart = this.$echarts.init(document.getElementById('myChart'))
this.chart.setOption(this.options)
}
}
}
</script>
<style scoped>
#myChart{
width: 400px;
height: 400px;
}
</style>
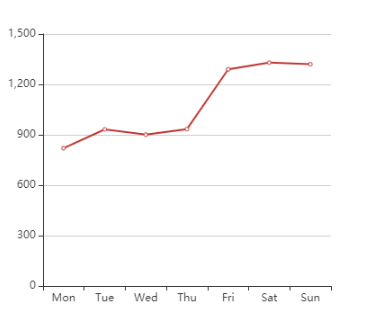
看看效果:
按需引用
全局引用是把Echarts完整的引入,这样做的缺点就是会额外的引入很多其他没有用的配置文件,可能会导致项目体积过大。如果因此资源加载的时间过长的话,也会影响人们的体验,毕竟人们都喜欢快和更快。
针对上述问题,我们可以采用按需引入的方式。如果有很多页面都需要用到
Echarts的话,那我们就在main.js中引入:
let echarts = require('echarts/lib/echarts')require('echarts/lib/chart/line')
require('echarts/lib/component/tooltip')
require('echarts/lib/component/title')
Vue.prototype.$echarts = echarts
如果只是在偶尔几个页面引用,也可以单独在.vue引入:
<script>let echarts = require('echarts/lib/echarts')
require('echarts/lib/chart/line')
require('echarts/lib/component/tooltip')
require('echarts/lib/component/title')
</script>
然后再改一下Echarts的配置项:
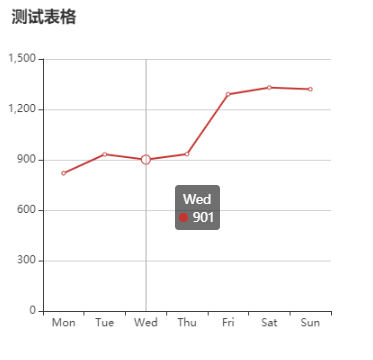
this.options = {title: {
text: "测试表格"
},
tooltip: {
trigger: 'axis'
},
xAxis: {
type: 'category',
data: ['Mon', 'Tue', 'Wed', 'Thu', 'Fri', 'Sat', 'Sun']
},
yAxis: {
type: 'value'
},
series: [{
data: [820, 932, 901, 934, 1290, 1330, 1320],
type: 'line'
}]
}
ref获取DOM
我们可以发现,上面的例子都是用getElementById()来获取渲染图表的div,同样我们也可以用ref来对真实的DOM进行操作。我们把代码作以下修改:
<template><div>
<div id="myChart" ref="myChart"></div>
</div>
</template>
initCharts () {// this.chart = this.$echarts.init(document.getElementById('myChart'))
this.chart = this.$echarts.init(this.$refs.myChart)
this.chart.setOption(this.options)
}
最终得到的效果是一样的
React中运用ECharts
在React中运用ECharts的方式和Vue有很多相似之处,只是在写法上有些许不同
全部引入
chart.jsx
import React, { Component } from 'react';import echarts from 'echarts'
import './chart.less';
export class App extends Component {
constructor(props) {
super(props);
this.state = {
data:[820, 932, 901, 934, 1290, 1330, 1320]
}
}
componentDidMount(){
this.initCharts();
}
//初始化
initCharts = () => {
let myChart = echarts.init(document.getElementById('myChart'));
let option = {
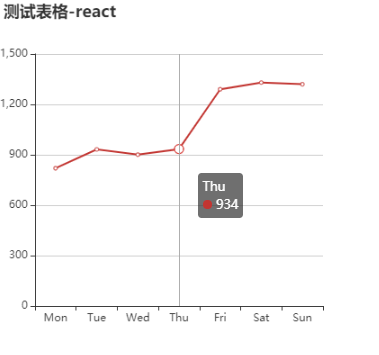
title: {
text: "测试表格-react"
},
tooltip: {
trigger: 'axis'
},
xAxis: {
type: 'category',
data: ['Mon', 'Tue', 'Wed', 'Thu', 'Fri', 'Sat', 'Sun']
},
yAxis: {
type: 'value'
},
series: [{
data: this.state.data,
type: 'line'
}]
};
myChart.setOption(option);
window.addEventListener("resize", function () {
myChart.resize();
});
}
render(){
return (
<div className="chart">
<div id="myChart"></div>
</div>
)
}
}
chart.less
.chart{display: flex;
flex: 1;
#myChart{
width: 400px;
height: 400px;
}
}
效果
按需引入
在React中,如果把ECharts整个引入,也会面临项目包体积过大所造成的负面影响。当然也可以在React中按需引入ECharts,方法和Vue类似
import echarts = 'echarts/lib/echarts'import 'echarts/lib/chart/line'
import 'echarts/lib/component/tooltip'
import 'echarts/lib/component/title'
在React-Hooks中使用
在以前没有Hook的时候,我们都是在class里面写代码,就如上述的方法一样。但是现在既然Hook这个好东西出来了,哪有不用的道理?
import React, { useEffect, useRef } from 'react';import echarts from 'echarts';
function MyChart () {
const chartRef = useRef()
let myChart = null
const options = {
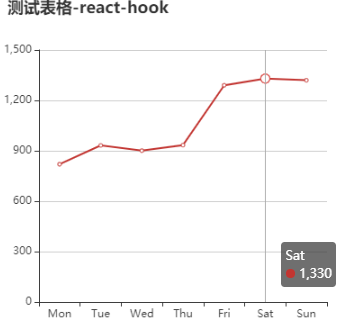
title: {
text: "测试表格-react-hook"
},
tooltip: {
trigger: 'axis'
},
xAxis: {
type: 'category',
data: ['Mon', 'Tue', 'Wed', 'Thu', 'Fri', 'Sat', 'Sun']
},
yAxis: {
type: 'value'
},
series: [{
data: [820, 932, 901, 934, 1290, 1330, 1320],
type: 'line'
}]
}
function renderChart() {
const chart = echarts.getInstanceByDom(chartRef.current)
if (chart) {
myChart = chart
} else {
myChart = echarts.init(chartRef.current)
}
myChart.setOption(options)
}
useEffect(() => {
renderChart()
return () => {
myChart && myChart.dispose()
}
})
return (
<>
<div style={{width: "400px", height: "400px"}} ref={chartRef} />
</>
)
}
export default MyChart
看看效果
既然我们已经在Hook中成功引用了Echarts,那么为何不把代码抽离出来,使之能让我们进行复用呢?我们可以根据实际情况把一些数据作为参数进行传递:
useChart.js
import React, { useEffect } from 'react';import echarts from 'echarts';
function useChart (chartRef, options) {
let myChart = null;
function renderChart() {
const chart = echarts.getInstanceByDom(chartRef.current)
if (chart) {
myChart = chart
} else {
myChart = echarts.init(chartRef.current)
}
myChart.setOption(options)
};
useEffect(() => {
renderChart()
}, [options])
useEffect(() => {
return () => {
myChart && myChart.dispose()
}
}, [])
return
}
export default useChart
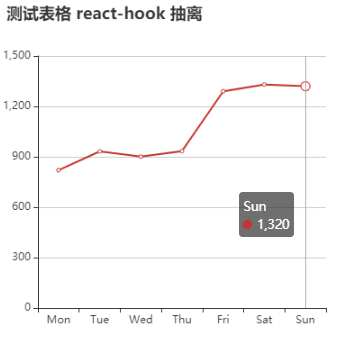
接下来引用我们刚抽离好的Hook:
import React, { useRef } from 'react'
import useChart from './useChart'
function Chart () {
const chartRef = useRef(null)
const options = {
title: {
text: "测试表格 react-hook 抽离"
},
tooltip: {
trigger: 'axis'
},
xAxis: {
type: 'category',
data: ['Mon', 'Tue', 'Wed', 'Thu', 'Fri', 'Sat', 'Sun']
},
yAxis: {
type: 'value'
},
series: [{
data: [820, 932, 901, 934, 1290, 1330, 1320],
type: 'line'
}]
}
useChart (chartRef, options)
return (
<>
<div style={{width: "400px", height: "400px"}} ref={chartRef} />
</>
)
}
export default Chart
最后
本文主要总结了ECharts作为数据可视化的高效工具在当今热门的几种前端框架中的基本用法。相信对于这方面接触较少的小伙伴来说应该还是会有一定的帮助滴~
文章若有不足或有更好建议,欢迎提出,大家一起讨论~
以上是 在Vue和React中使用ECharts的多种方法 的全部内容, 来源链接: utcz.com/a/40705.html