如何用python画出样本的散点图?

用python画样本散点图的方法:
数据(取第一列作为x,取第四列作为y)如下:
实现代码如下:
import matplotlib.pyplot as pltimport numpy as np
# 定义画散点图的函数
def draw_scatter(n, s):
"""
:param n: 点的数量,整数
:param s:点的大小,整数
:return: None
"""
# 加载数据
data = np.loadtxt('results.txt', encoding='utf-8', delimiter=',')
# 通过切片获取横坐标x1
x1 = data[:, 0]
# 通过切片获取纵坐标R
y1 = data[:, 3]
# 横坐标x2
x2 = np.random.uniform(0, 5, n)
# 纵坐标y2
y2 = np.array([3] * n)
# 创建画图窗口
fig = plt.figure()
# 将画图窗口分成1行1列,选择第一块区域作子图
ax1 = fig.add_subplot(1, 1, 1)
# 设置标题
ax1.set_title('Result Analysis')
# 设置横坐标名称
ax1.set_xlabel('gamma-value')
# 设置纵坐标名称
ax1.set_ylabel('R-value')
# 画散点图
ax1.scatter(x1, y1, s=s, c='k', marker='.')
# 画直线图
ax1.plot(x2, y2, c='b', ls='--')
# 调整横坐标的上下界
plt.xlim(xmax=5, xmin=0)
# 显示
plt.show()
# 主模块
if __name__ == "__main__":
# 运行
draw_scatter(n=2000, s=20)
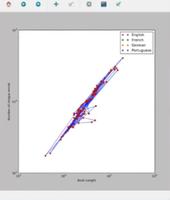
实现效果如下:
更多Python知识请关注。
以上是 如何用python画出样本的散点图? 的全部内容, 来源链接: utcz.com/z/527326.html