VS Code 使用 Debugger for Chrome 调试vue
配置:
launch.json
{
// 使用 IntelliSense 了解相关属性。
// 悬停以查看现有属性的描述。
// 欲了解更多信息,请访问: https://go.microsoft.com/fwlink/?linkid=830387
"version": "0.2.0",
"configurations": [
{
"type": "chrome",
"request": "launch",
"name": "vuejs: chrome",
"url": "http://127.0.0.1:9528",
"webRoot": "${workspaceFolder}/src",
"breakOnLoad": true,
"sourceMapPathOverrides": {
"webpack:///src/*": "${webRoot}/*"
}
}
]
}
官方说明文档:https://cn.vuejs.org/v2/cookbook/debugging-in-vscode.html
使用流程:
1、安装Debugger for Chrome插件
2、Debugger 图标来到 Debug 视图,然后点击那个齿轮图标来配置一个 launch.json 的文件。如上图,项目运行地址配置为:http://127.0.0.1:9528
3、项目设置断点
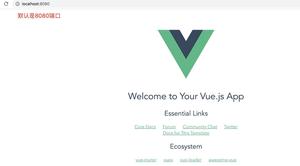
4、在终端并使用 Vue CLI 开启这个应用:npm run serve。实际代码为:vue-cli-service serve
5、来到 Debug 视图,选择“vuejs:chrome/firefox”配置,然后按 F5 或点击那个绿色的 play 按钮
6、命中断点
以上是 VS Code 使用 Debugger for Chrome 调试vue 的全部内容, 来源链接: utcz.com/z/376668.html