eCharts 默认显示tooltip提示框内容
后台返回的数据内容及代码如下:
x轴的数据
xAxisDate = ['11/1','11/2','11/3','11/4'......]
arr1 = [10,10,20,30,40,50,'-']
arr2 = [10,10,20,'-','-','-','-']
arr3 = [10,10,20,'-','-','-','-']
var option = { title: {
text: '山东东价格趋势(盘螺)'
},
tooltip: {
trigger: 'axis'
},
legend: {
top:40,
data: ['镔鑫厂内价格', '永锋青岛价格', '西王青岛价格']
},
grid: {
top:80,
left: '5%',
right: '5%',
bottom: '3%',
containLabel: true
},
xAxis: {
type: 'category',
boundaryGap: false,
data: xAxisDate
},
yAxis: {
type: 'value',
min: function (value) {
return value.min - 200;
},
max: function (value) {
return value.max + 200;
}
},
series: [
{
name: '镔鑫厂内价格',
type: 'line',
data: arr1
},
{
name: '永锋青岛价格',
type: 'line',
data: arr2
},
{
name: '西王青岛价格',
type: 'line',
data: arr3
}
]
};
myChart.setOption(option)
调用dispatchAction
myChart.dispatchAction({ type: 'showTip',
seriesIndex:1,
dataIndex: arr1.length -1
})
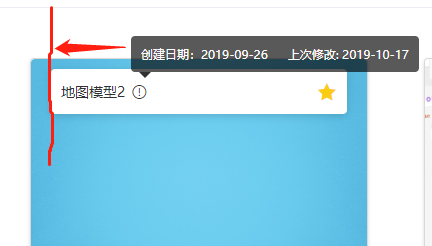
当指定获dataIndex的值处在 3个数组当中的值为 ‘-’ 的 tooltip提示框就无法限时,如图: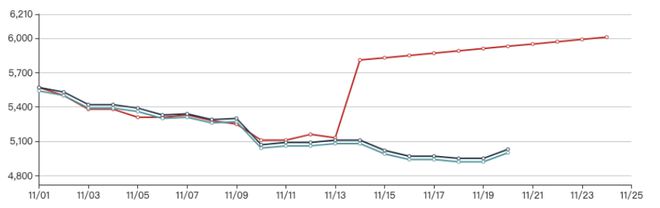
最终的效果是默认显示最后一天的内容,类似这样的效果: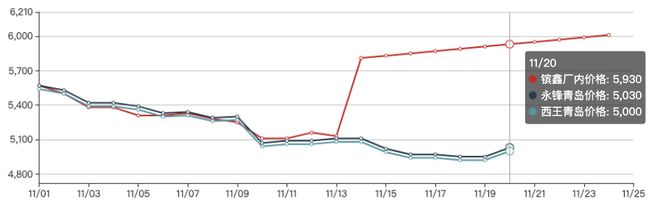
请问怎么有什么办法可以解决?(排除把数组中的‘-’,值替换成0或其他数字)
以上是 eCharts 默认显示tooltip提示框内容 的全部内容, 来源链接: utcz.com/p/936544.html