请问怎么样通过定位坐标显示对应数据?
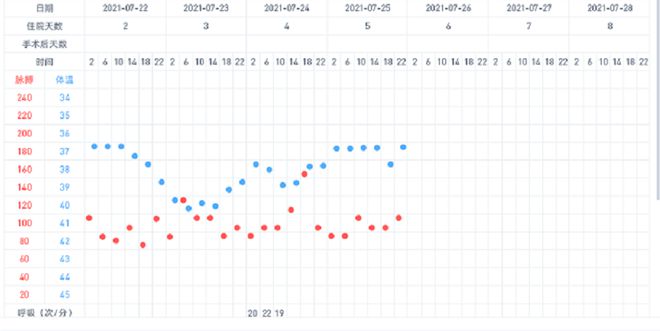
需求图片
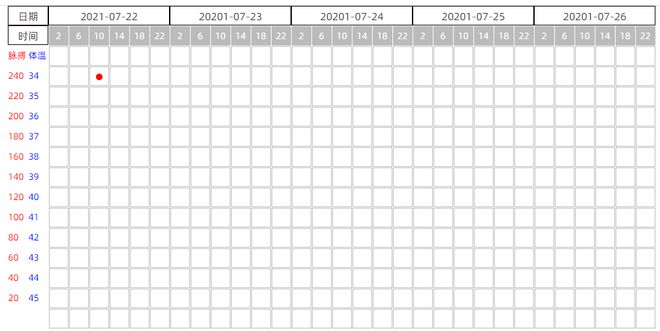
画个大概
代码如下
<template> <div class="grid">
<div class="left-wrap">
<div class="time">日期</div>
<div class="time">时间</div>
<div class="info">
<div class="pulse">
<div v-for="(item,i) in pulse" :key="item" >
<span>{{item}}</span>
</div>
</div>
<div class="temp">
<div v-for="(item,i) in temp" :key="item" >
<span>{{item}}</span>
</div>
</div>
</div>
</div>
<div class="right-wrap">
<div class="date-content">
<div v-for="(date,i) in dateArr">{{date}}</div>
</div>
<div class="hours">
<div v-for="(day,i) in dayArr" :key="Math.random() + day" >
<span v-for="(hours,index) in dayArr[i]" :key="Math.random() + hours">
{{dayArr[i][index]}}
</span>
</div>
</div>
<div class="empty-content-row">
<div v-for="col in emptyCols" :key="Math.random() + col" class="value-content-row">
<span v-for="row in rows" :key="Math.random() + row" class="value-block">
<template>
<span class="normal"></span>
</template>
</span>
</div>
</div>
<div v-for="col in cols" :key="Math.random() + col" class="value-content-row">
<span v-for="row in rows" :key="Math.random() + row" class="value-block">
<template>
<span v-if="lattice[(col - 1) * rows + row - 1].isShow" class="dot"></span>
<span class="normal" v-else>{{ lattice[(col - 1) * rows + row - 1].index }}</span>
</template>
</span>
</div>
</div>
</div>
</template>
<script>
export default {
data() {
return {
// 横排格子数
rows: 30,
// 纵排格子数
cols: 13,
// 格子总数
latticeNum: 0,
lattice: [{
index: 0, // 格子索引
isShow: false, // 是否显示
}],
emptyCols:1,
// 初始化高亮数据
lightData:[[0,3]],
dayArr:[[2,6,10,14,18,22],[2,6,10,14,18,22],[2,6,10,14,18,22],[2,6,10,14,18,22],[2,6,10,14,18,22]],
pulse:['脉搏',240,220,200,180,160,140,120,100,80,60,40,20],
temp:['体温',34,35,36,37,38,39,40,41,42,43,44,45],
dateArr:['2021-07-22','20201-07-23','20201-07-24','20201-07-25','20201-07-26']
}
},
created() {
this.latticeNum = this.rows * this.cols;
this.getInitLightArr()
// 给每个格子赋予正确的属性
this.initLattice();
},
methods: {
// 格子属性初始化
initLattice() {
let latticeArr = [];
for (let n = 1; n < this.latticeNum +1; n++) {
let lattice = {
index: n
};
// 标记是否显示
if(this.getInitLightArr().indexOf(n) > -1){
lattice.isShow = true
}
latticeArr.push(lattice);
}
this.lattice = latticeArr;
},
//高亮数据
getInitLightArr(){
let num = 0
let arr = []
for (let t = 0; t < this.lightData.length; t++) {
num = (this.lightData[t][0] * this.rows) + this.lightData[t][1]
}
arr.push(num)
return arr
},
}
}
</script>
<style lang="scss" scoped>
.grid{
display: flex;
width: 1000px;
margin: 0 auto;
.left-wrap{
.time{
text-align: center;
width: 62px;
height: 30px;
line-height: 30px;
background-color: #fff;
border: 1px solid black;
}
.info{
display: flex;
.pulse,.temp{
span{
margin: 0.5px;
display: inline-block;
width: 30px;
height: 30px;
line-height: 30px;
font-size: 14px;
color: red;
background: #fff;
}
}
.temp{
span{
color: blue;
}
}
}
}
.right-wrap{
max-width: 1200px;
overflow: auto;
width: 1200px;
display: flex;
flex-wrap: nowrap;
flex-direction: column;
.hours{
display: flex;
div{
display: flex;
span{
display: inline-block;
margin: 0.5px;
background-color: #bbb;
width: 30px;
height: 30px;
line-height: 30px;
font-size: 14px;
color: #fff;
text-align: center;
cursor: pointer;
}
}
}
.value-content-row {
display: flex;
flex-direction: row;
width: fit-content;
font-size: 0;
.value-block {
display: inline-block;
margin: 0.5px;
border:1px solid #bbb;
width: 30px;
height: 30px;
line-height: 30px;
font-size: 14px;
color: #fff;
text-align: center;
cursor: pointer;
.dot{
display: inline-block;
width: 10px;
height: 10px;
background-color: red;
border-radius: 50%;
}
.normal{
visibility: hidden;
}
}
}
.date-content{
display: flex;
div{
border: 1px solid black;
min-width: 186px;
height: 30px;
line-height: 30px;
text-align: center;
}
}
}
}
</style>
横坐标是日期 1天6个小格 每一小格是4个小时
纵坐标是温度或者体温值
假如给了数据2021-07-22 2:30 温度34.5
因为一个格子左右区间是2,3,4,5小时 上下温度区间34.0 - 34.9 要如精准何定位到对应的位置显示圆点呢,麻烦大佬们指点一下
回答:
可以在lattice中每一个item定义偏移标记
在getInitLightArr中判断是否在 (x,x+1]之间 并把偏移百分比传入
例如当前值是34.7 属于34这个单元格 偏移0.7 相对于单位1 就是70%;
最后在 dot span中根据偏移的百分比传入style transform: translateY(percent * 10px);
以上是 请问怎么样通过定位坐标显示对应数据? 的全部内容, 来源链接: utcz.com/p/936338.html


