会议预定记录钟表盘展示功能怎么实现?
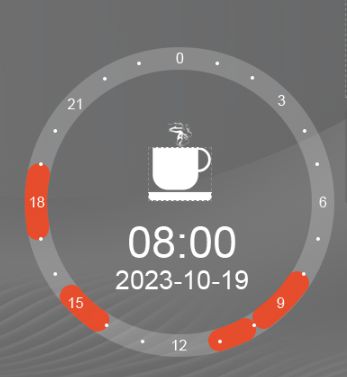
类似于图片这种效果,总共24个刻度。
某个时间段有会议,则显示图片中橙色部分的样式。
每场会议以30分钟为基本单位。
请各位大佬指教
回答:
用 svg,path 绘制圆弧:

import { Fragment } from "react";import "./assets/app.scss";
const a = (n: number) => Array.from({ length: n });
export default function App() {
const r = 190,
d = new Date(),
x = (rad: number) => 250 + Math.sin(2 * Math.PI * rad) * r,
y = (rad: number) => 250 - Math.cos(2 * Math.PI * rad) * r,
times: [[number, number?], [number, number?]][] = [
[[8], [10]],
[[10], [11, 10]],
[[14], [15, 10]],
[[17], [19]],
];
return (
<svg width="500" height="500">
<circle id="main-circle" cx="250" cy="250" r={r} />
{times.map((t, i) => {
const w = 25,
d = w / 2 / (2 * Math.PI * r);
let [r1, r2] = t.map(
([a, b]: [number, number?]) => a / 24 + (b ?? 0) / (60 * 24)
);
r1 += d;
r2 -= d;
return (
<path
key={i}
className="arc"
stroke="orange"
strokeWidth={w}
fill="transparent"
strokeLinecap="round"
d={`M ${x(r1)} ${y(r1)} A ${r} ${r} 0 0 1 ${x(r2)} ${y(r2)}`}
/>
);
})}
{a(8).map((_, i) => (
<text key={i} className="num" x={x(i / 8)} y={y(i / 8)}>
{i * 3}
</text>
))}
{a(24).map((_, i) =>
i % 3 ? (
<circle key={i} r="3" fill="white" cx={x(i / 24)} cy={y(i / 24)} />
) : (
<Fragment key={i} />
)
)}
<text id="t" x="250" y="300">
{d.toLocaleTimeString(undefined, {
hour: "2-digit",
minute: "2-digit",
})}
</text>
<text id="d" x="250" y="330">
{d.toLocaleDateString()}
</text>
</svg>
);
}
#root { svg {
background: #6a6a6a;
#main-circle {
stroke: #888888;
fill: transparent;
stroke-width: 25px;
}
.num,
#d,
#t {
fill: white;
font-family: sans-serif;
text-anchor: middle;
alignment-baseline: middle;
// translate: -50% -50%;
// font-size: 10px;
}
#t {
font-size: 40px;
}
#d {
font-size: 30px;
}
}
}
回答:
使用Canvas可以实现该表盘,做个固定的背景图就行了,我给你个demo
你改 ctx.arc(200, 200, 170, convertNum(0), convertNum(3)); 后面两个参数就能实现几点到几点了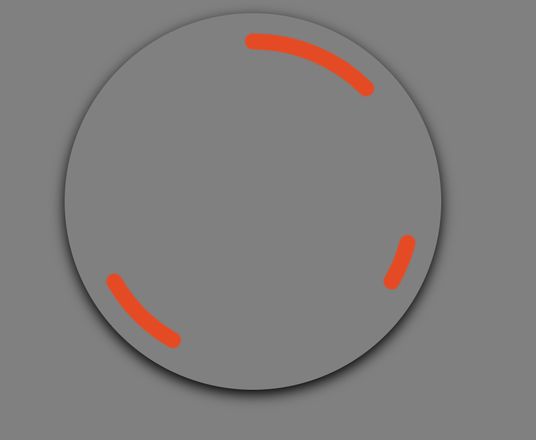
<!DOCTYPE html>
<html lang="zh-CN">
<head>
<meta charset="UTF-8" />
<meta name="viewport" content="width=device-width, initial-scale=1.0" />
<title>Document</title>
</head>
<style>
body {
background-color: gray;
}
h1 {
font-family: helvetica;
font-size: 2.5rem;
color: black;
position: relative;
top: 80px;
z-index: -1;
}
#canvas {
display: block;
margin: 5vh auto;
border-radius: 50%;
box-shadow: 0 5px 14px black;
}
</style>
<body>
<canvas id="canvas" width="400" height="400"></canvas>
</body>
<script>
var canvas = document.getElementById("canvas");
var ctx = canvas.getContext("2d");
ctx.strokeStyle = "#e44b24";
ctx.lineWidth = 17;
ctx.lineCap = "round";
// ctx.shadowBlur = 15;
// ctx.shadowColor = '#28d1fa';
function degToRad(degree) {
var factor = Math.PI / 180;
return degree * factor;
}
// 转换数值 360度转换成24份,并修正从0点开始
function convertNum(num) {
return degToRad(num * 15 - 90);
}
function draw() {
var now = new Date();
var today = now.toDateString();
var time = now.toLocaleTimeString();
var hours = now.getHours();
var minutes = now.getMinutes();
var seconds = now.getSeconds();
var milliseconds = now.getMilliseconds();
var newSeconds = seconds + milliseconds / 1000;
// Background
gradient = ctx.createRadialGradient(200, 200, 5, 200, 200, 300);
ctx.fillStyle = gradient;
ctx.fillRect(0, 0, 400, 400);
// 0点到3点
ctx.beginPath();
ctx.arc(200, 200, 170, convertNum(0), convertNum(3));
ctx.stroke();
// 7到8
ctx.beginPath();
ctx.arc(200, 200, 170, convertNum(7), convertNum(8));
ctx.stroke();
// 14-16
ctx.beginPath();
ctx.arc(200, 200, 170, convertNum(14), convertNum(16));
ctx.stroke();
}
draw();
</script>
</html>
回答:
我觉得可以用 SVG 画。
- 首先是画饼图,可以参考我这篇博客 使用 SVG 制作扇形
- 然后给外环加上边框
stroke即可
回答:
有一说一,你这个刻度要是用canvas做的话反而最难
以上是 会议预定记录钟表盘展示功能怎么实现? 的全部内容, 来源链接: utcz.com/p/935125.html