xCharts 精美的 JavaScript 图表库插件
xCharts 是一个使用 D3.js 来构建漂亮的可定制的数据驱动的 JavaScript 图表库,他使用 HTML、CSS、SVG 实现网页端图表,xCharts 被设计为一个动态的、流畅的、开放的和可定制化的库。
使用教程
快速启动
下载 D3.js 和 xCharts
下载并在你的页面上引入 D3.js 和 xCharts 文件,xCharts 包含两个文件, xcharts.js 脚本和 xcharts.css 样式表文件。
配置您的数据
配置您的数据使用 xchart 的 Data 格式参数。
设置你的页面
添加一个预定义宽度和高度元素到你的网页来显示你的图表元素:
<figure style="width: 400px; height: 300px;" id="myChart"></figure>xCharts 将自适应你给的元素的宽度和高度。重要的是要有这些值集的元素或样式表中。在窗口的大小、元素的大小,xCharts 将自动调整到相应的尺寸,所以它可以继续适合所分配的空间。
创建图表
var myChart = new xChart('bar', data, '#myChart');Data 格式
xCharts 使用其输入数据来指导如何数据集应绘制。通过提供以下数据格式,一个 xChart 将指示与线性表的绘制顺序图,包含两个顺序蜱的 X 轴上的 Pepperoni 和 Cheese。这也将是一次虚线部分覆盖在顶部。
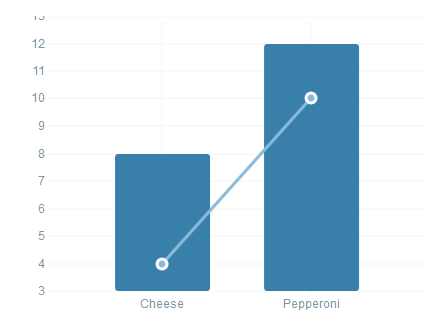
{ "xScale": "ordinal", "yScale": "linear", "type": "bar",
"main": [{
"className": ".pizza", "data": [ {
"x": "Pepperoni", "y": 12
}, {
"x": "Cheese", "y": 8
} ] } ], "comp": [ {
"className": ".pizza", "type": "line-dotted", "data": [ {
"x": "Pepperoni", "y": 10
}, {
"x": "Cheese", "y": 4
} ] } ]
}
xScale
Scale type to use along the x-axis (horizontal).
- Type
string- Valid Options
- ordinal
- linear
- time
- exponential
yScale
Scale type to use along the y-axis (vertical).
- Type
string- Valid Options
- ordinal
- linear
- time
- exponential
xMin
Minimum allowed value on the xScale. If null, uses the data’s min value, logically padded for aesthetics. Does not affect ordinal scales.
- Type
Number
xMax
Maximum allowed value on the xScale. If null, uses the data’s max value, logically padded for aesthetics. Does not affect ordinal scales.
- Type
Number
yMin
Minimum allowed value on the yScale. If null, uses the data’s min value, logically padded for aesthetics. Does not affect ordinal scales.
- Type
Number
yMax
Maximum allowed value on the yScale. If null, uses the data’s max value, logically padded for aesthetics. Does not affect ordinal scales.
- Type
Number
typeoptional
The vis type to force the main data to display with. If not provided, will use the last set vis type, or the one provided at xChart creation time.
- Type
string- Valid Options
- bar
- cumulative
- line
- line-dotted
main
An array of data sets to be drawn.
- Type
Array
{ "className": ".pizza",
"data": [
{
"x": "Pepperoni",
"y": 12
},
{
"x": "Cheese",
"y": 8
}
]
}
className
一个独特的CSS选择器类使用识别图表上的元素。
它注意到,这应该是唯一的每个图更加重要。xcharts使用这个值来确定是否应该销毁或更新的可视化数据变化时。如果你使用这个选择器,当前显示的可视化使用该选择器将过渡相匹配的新的数据。
data
含x和y的值对象的数组。这些数据将被转换为升序排序的xcharts。
compoptional
的数据集被用来作为比较的主要数据集的数组。这一套不同于main,每一组必须有自己独立的光谱型
- Type
Array
Methods
setData(data)
更改数据,图表和动画从当前显示的最新数据。
- data
- Type
object
setType(type)
Change the vis type for this chart and animate the display.
- type
- The vis type to force the main data to display with. If not provided, will use the last set vis type, or the one provided at xChart creation time.
- Type
string- Valid Options
- bar
- cumulative
- line
- line-dotted
setScale(axis, type)
Update an axis’ scale type.
- axis
- The axis to change
- Type
string- Valid Options
- x
- y
- type
- Scale type to use along the y-axis (vertical).
- Type
string- Valid Options
- ordinal
- linear
- time
- exponential
Chart Options
mouseover
Callback behavior for a user mousing over a data point.
- Type
function- Default
function (data, i) {}- Arguments
- data
- data for the element that was clicked
- i
- the index of the data in the set
mouseout
Callback behavior for a user mousing off a data point.
- Type
function- Default
function (data, i) {}- Arguments
- data
- data for the element that was clicked
- i
- the index of the data in the set
click
Callback behavior for a user clicking a data point.
- Type
function- Default
function (data, i) {}- Arguments
- data
- data for the element that was clicked
- i
- the index of the data in the set
axisPaddingTop
Amount of space between the top of the chart and the top value on the y-scale.
- Type
Number
axisPaddingRight
Amount of space between the right side of the chart and the highest value on the x-scale.
- Type
Number
axisPaddingBottom
Amount of space between the bottom of the chart and the lowest value on the y-scale.
- Type
Number- Default
5
axisPaddingLeft
Amount of space between the left side of the chart and the lowest value on the x-scale.
- Type
Number- Default
20
xMin
Minimum allowed value on the xScale. If null, uses the data’s min value, logically padded for aesthetics. Does not affect ordinal scales. May be overrided using the setData method with the xMin data format key.
- Type
Number- Default
null
xMax
Maximum allowed value on the xScale. If null, uses the data’s max value, logically padded for aesthetics. Does not affect ordinal scales. May be overrided using the setData method with the xMax data format key.
- Type
Number- Default
null
yMin
Minimum allowed value on the yScale. If null, uses the data’s min value, logically padded for aesthetics. Does not affect ordinal scales. May be overrided using the setData method with the yMin data format key.
- Type
Number- Default
null
yMax
Maximum allowed value on the yScale. If null, uses the data’s max value, logically padded for aesthetics. Does not affect ordinal scales. May be overrided using the setData method with the yMax data format key.
- Type
Number- Default
null
paddingTop
Amount of space from the top edge of the svg element to the beginning of the axisPaddingTop.
- Type
Number
paddingRight
Amount of space from the right edge of the svg element to the beginning of the axisPaddingRight.
- Type
Number
paddingBottom
Allows space for the x-axis scale. Controls the amount of space from the bottom edge of the svg element to the beginning of the axisPaddingBottom.
- Type
Number- Default
20
paddingLeft
Allows space for the y-axis scale. Amount of space from the left edge of the svg element to the beginning of the axisPaddingLeft.
- Type
Number- Default
60
tickHintX
The amount of ticks that you would like to have displayed on the x-axis. Note: this is merely a guide and your results will likely vary.
- Type
Number- Default
10
tickFormatX
Provide alternate formatting for the x-axis tick labels.
- Type
function- Default
function (x) { return x; }- Arguments
- x
- default tick value
tickHintY
The amount of ticks that you would like to have displayed on the y-axis. Note: this is merely a guide and your results will likely vary.
- Type
Number- Default
10
tickFormatY
Provide alternate formatting for the y-axis tick labels.
- Type
function- Default
function (y) { return y; }- Arguments
- y
- default tick value
dataFormatX
A method to pre-format the input data for the x-axis before attempting to compute a scale or draw.
- Type
function- Default
function (x) { return x; }- Arguments
- x
- datum x-value
dataFormatY
A method to pre-format the input data for the y-axis before attempting to compute a scale or draw.
- Type
function- Default
function (y) { return y; }- Arguments
- y
- datum y-value
sortX
Provide a method to custom-sort x-axis data. Must be a valid array comparator, returning -1, 0, or 1.
- Type
function- Default
function (a, b) {return (!a.x && !b.x) ? 0 : (a.x < b.x) ? -1 : 1;
}
- Arguments
- a
- datum object
- b
- datum object
unsupported
A callback method that will be invoked if SVG is not supported in the viewer’s browser.
- Type
function- Default
function (selector) {d3.select(selector).text('SVG is not supported on your browser');
}
- Arguments
- selector
- the selector used for this xChart’s constructor
noDataMainOnly
TODO: fix and remove this
- Type
boolean- Default
true
empty
A callback method invoked when the data set provided was empty and there is nothing to draw.
- Type
function- Default
function (self, selector, data) {}- Arguments
- self
- the xChart instance
- selector
- the selector used for this xChart’s constructor
- data
- the chart’s main data array
notempty
The opposite of empty. Invoked if the data set provided was not empty.
- Type
function- Default
function (self, selector) {}- Arguments
- self
- the xChart instance
- selector
- the selector used for this xChart’s constructor
timing
The amount of time, in milliseconds, to transition during draw/update.
- Type
Number- Default
750
interpolation
Line interpolation to use when drawing lines. See d3.js’s line.interpolate for more information.
- Type
string- Default
monotone
Custom Scales
By default, xCharts includes four scale types: ordinal, linear, time, and exponential. However, you can create custom scale types very easily.
function myScale(data, axis, bounds, extents) { return d3.scale.linear()
.domain(extents)
.nice()
.rangeRound(bounds);
}
xChart.setScale('scale-name', myScale);
Arguments
- data
object- Merged set of all data that will be displayed on the chart.
- axis
string- Either x or y.
- bounds
array- Min and max screen position values for the given axis.
- extents
array- Min and max values for the data.
Styling Your Chart
Since xCharts (and D3.js) use SVG, we are able to accomplish most of our styling of xCharts directly through CSS. This means that, unlike many other charting libraries, you have quite a bit of control to handle the visualization however you want.
Included in the xCharts download is a starter stylesheet—one that will produce the same visual style that is given on this site. This file is generated via a LESS file, available from the GitHub repository.
The best way to style charts is to start with the included stylesheet, or use your browser’s element inspector to see each elements CSS class selectors that are available to use.
Series Colors
Each series in the chart is assigned a class, based on its index in your main and comp data sets: .color0 through .colorN. While there can be an infinite amount of colors, it is recommended that you never chart more than 10 series at a time. Thus, only 10 colors are included in the starter stylesheet.
Custom Vis Types
xCharts follows the “Enter, Update, Exit” methodology of D3.js. If you’re unfamiliary with D3, a good starting reference point is Thinking With Joins.
To create your own vis type and make it available to xCharts, simply create an object of the necessary methods and define it for xCharts using the xChart.setVis(name, methods); method.
var myVis = { preUpdateScale: function () { /*...*/ }, // optional
postUpdateScale: function () { /*...*/ }, // optional
enter: function () { /*...*/ },
update: function () { /*...*/ },
exit: function () { /*...*/ },
destroy: function () { /*...*/ }
};
xChart.setVis('myvis', MyVis);
Extending Base Vis Types
It can be useful, at times, to extend a base vis type. For example, if you’d like to create a vis type that uses logic from the line vis type, simply ask xChart for the methods and reuse them:
var line = xChart.getVis('line');var myVis = {
enter: function (self, storage, className, data) {
line.enter.apply(this, arguments);
// Do your custom actions here
},
update: function (self, storage, timing) {
line.update.apply(this, arguments);
// Do your custom actions here
},
exit: function (self, storage, timing) {
line.exit.apply(this, arguments);
// Do your custom actions here
},
destroy: function (self, storage, timing) {
line.destroy.apply(this, arguments);
// Do your custom actions here
},
};
xChart.setVis('myvis', myVis);
For a more detailed and working example, check out the Error Bars Custom Vis Type.
Methods
preUpdateScale(self, scaleData, mainData, compData)
Optional. Executed before the scales have been created for the given data sets.
- self
- the xChart instance
- scaleData
- The union of the main and comp data sets
- mainData
- The main data set
- compData
- The comp data set
In cumulative charts, before we create the scale, we need to actually convert our raw data into cumulative data.
This example is very barebones and for demonstration only. The actual process used by the cumulative vis type is much more involved and handles actually setting values and remembering original states.
function preUpdateScale(self, data, mainData, compData) { mainData = accumulateData(mainData);
compData = accumulateData(compData);
}
postUpdateScale(self, scaleData, mainData, compData)
Optional. Executed after the scales have been created for the given data sets.
- self
- the xChart instance
- scaleData
- The union of the main and comp data sets
- mainData
- The main data set
- compData
- The comp data set
In bar charts, we need to create a second scale that will inform us how wide each bar series should be, and where they should be placed. For this, we use postUpdateScale to calculate a second ordinal scale, with reference to the first:
function postUpdateScale(self, scaleData, mainData, compData) { self.xScale2 = d3.scale.ordinal()
.domain(d3.range(0, mainData.length))
.rangeRoundBands([0, self.xScale.rangeBand()], 0.08);
}
enter(self, storage, className, data)
As the first draw step, enter is used to create any elements that we need and bind the data information to each element.
- self
- The xChart instance
- storage
- A persistent object specific to this vis type for you to store data for later retrieval.
- className
- A set of CSS classNames, dot-separated, that are recommended to be appended to the main element of this vis.
- data
- The data that should be used for drawing this vis.
function enter(self, storage, className, data, callbacks) { // Create a basic SVG line, setting the x-values based on the xScale
var line = d3.svg.line()
.interpolate(self._options.interpolation),
container,
paths;
// Create a container for each series in the data set
// Notice how `className` is used here as a way to persist objects across updates
container = self._g.selectAll(selector + className)
.data(data, function (d) {
return d.className;
});
container.enter().insert('g', insertBefore)
.attr('data-index', zIndex)
.attr('class', function (d, i) {
var cl = _.uniq((className + d.className).split('.')).join(' ');
// Notice how we append both a vis-type class and the indexed color class to each
return cl + ' line color' + i;
});
// In each container, we create a line and apply the y-scale as necessary
paths = container.selectAll('path.line')
.data(function (d) { return [d.data]; });
paths.enter().append('path')
.attr('class', 'line')
.style('opacity', 0)
.attr('d', storage.line
.x(function (d) { return self.xScale(new Date(d.x)); })
.y(function (d) { return self.yScale(d.y); })
);
// We will want these later during the update method
storage.lineContainers = container;
storage.linePaths = paths;
storage.line = line;
}
update(self, storage, timing)
During update, we loop over every element and transition its appearance, based on any changes that may have been made to our data series.
- self
- The xChart instance
- storage
- A persistent object specific to this vis type for you to store data for later retrieval.
- timing
- Time, in milliseconds, for running transitions.
Using our previous example from enter, we’ll continue with updating our lines:
function update(self, storage, timing) { // Update each line
storage.linePaths.transition().duration(timing)
.style('opacity', 1)
.attr('d', storage.line
.x(function (d) { return self.xScale(new Date(d.x)); })
.y(function (d) { return self.yScale(d.y); })
);
}
exit(self, storage, timing)
Called as the last step of updating a vis, in this method we hide any visual elements that are no longer being used–elements from a previous data series that no longer exist in the new series.
- self
- The xChart instance
- storage
- A persistent object specific to this vis type for you to store data for later retrieval.
- timing
- Time, in milliseconds, for running transitions.
During the exit method, we merely provide instructions for hiding the visual elements:
function exit(self, storage, timing) { storage.lineContainers.exit().transition().duration(timing)
.style('opacity', 0);
}
destroy(self, storage, timing)
In the last step of our vis, we remove all displayed elements. This method is most called when xChart is instructed to change vis-types for the entire chart.
- self
- The xChart instance
- storage
- A persistent object specific to this vis type for you to store data for later retrieval.
- timing
- Time, in milliseconds, for running transitions.
Since we’ll be removing everything here, we’ll transition the opacity to zero and then remove the elements:
function destroy(self, storage, timing) { storage.lineContainers.transition().duration(timing)
.style('opacity', 0)
.remove();
}
下载地址:https://www.wenjiangs.com/wp-content/uploads/2018/04/xcharts-build.tar.gz
在线示例:http://run.wenjiangs.com/code/#/?code=h5eJXr40
以上是 xCharts 精美的 JavaScript 图表库插件 的全部内容, 来源链接: utcz.com/p/231852.html