vue 使用echarts的图表进行联动 echarts.connect()方法无效,
export default {
name: 'hello',data() {
return {
msg: 'Welcome to Your Vue.js App'
}
},
mounted() {
this.drawLine();
},
methods: {
drawLine() {
// 绘制图表
var myChart1 = this.$echarts.init(document.getElementById('main1'))
var myChart2 = this.$echarts.init(document.getElementById('main2'))
var myChart3 = this.$echarts.init(document.getElementById('main3'))
var myChart4 = this.$echarts.init(document.getElementById('main4'))
var option1 = {
dataZoom:{
show:false
},
title: {
text: '温度状况',
subtext: '纯属虚构'
},
tooltip: {
trigger: 'axis'
},
legend: {
data: ['设定温度', '进水温度', '出水温度', '环境温度']
},
toolbox: {
show: true,
feature: {
mark: {
show: true
},
dataView: {
show: true,
readOnly: false
},
magicType: {
show: true,
type: ['line']
},
restore: {
show: true
},
saveAsImage: {
show: true
}
}
},
xAxis: [{
type: 'category', //x轴为类目类型
axisLabel: {
show: true,
interval: 0,
rotate: 45
},
data: ['00:00:00', '00:05:00', '00:10:00', '00:15:00', '00:20:00', '00:25:00', '00:30:00', '00:35:00',
'00:40:00', '00:45:00'
]
}],
yAxis: [{
type: 'value' //y轴为值类型
}],
series: [{
name: '设定温度',
type: 'line',
smooth: true,
data: [55, 55, 55, 55, 55, 55, 55, 55, 55, 55]
}]
}
var option2 = {
dataZoom:{
show:false
},
tooltip: {
trigger: 'axis'
},
legend: {
y: -30,
data: ['设定温度', '进水温度', '出水温度', '环境温度']
},
toolbox: {
y: -30,
show: true,
feature: {
mark: {
show: true
},
dataView: {
show: true,
readOnly: false
},
magicType: {
show: true,
type: ['line']
},
restore: {
show: true
},
saveAsImage: {
show: true
}
}
},
xAxis: [{
type: 'category', //x轴为类目类型
axisLabel: {
show: true,
interval: 0,
rotate: 45
},
data: ['00:00:00', '00:05:00', '00:10:00', '00:15:00', '00:20:00', '00:25:00', '00:30:00', '00:35:00',
'00:40:00', '00:45:00'
]
}],
yAxis: [{
type: 'value' //y轴为值类型
}],
series: [{
name: '进水温度',
type: 'line',
smooth: true,
data: [15, 15, 16, 18, 18, 19, 19, 19, 19, 19]
}]
}
var option3 = {
dataZoom:{
show:false
},
tooltip: {
trigger: 'axis'
},
legend: {
y: -30,
data: ['设定温度', '进水温度', '出水温度', '环境温度']
},
toolbox: {
y: -30,
show: true,
feature: {
mark: {
show: true
},
dataView: {
show: true,
readOnly: false
},
magicType: {
show: true,
type: ['line']
},
restore: {
show: true
},
saveAsImage: {
show: true
}
}
},
xAxis: [{
type: 'category', //x轴为类目类型
axisLabel: {
show: true,
interval: 0,
rotate: 45
},
data: ['00:00:00', '00:05:00', '00:10:00', '00:15:00', '00:20:00', '00:25:00', '00:30:00', '00:35:00',
'00:40:00', '00:45:00'
]
}],
yAxis: [{
type: 'value' //y轴为值类型
}],
series: [{
name: '出水温度',
type: 'line',
smooth: true,
data: [20, 25, 30, 35, 38, 44, 46, 48, 53, 56]
}]
}
var option4 = {
dataZoom:{
show:false
},
tooltip: {
trigger: 'axis'
},
legend: {
y: -30,
data: ['设定温度', '进水温度', '出水温度', '环境温度']
},
toolbox: {
y: -30,
show: true,
feature: {
mark: {
show: true
},
dataView: {
show: true,
readOnly: false
},
magicType: {
show: true,
type: ['line']
},
restore: {
show: true
},
saveAsImage: {
show: true
}
}
},
xAxis: [{
type: 'category', //x轴为类目类型
axisLabel: {
show: true,
interval: 0,
rotate: 45
},
data: ['00:00:00', '00:05:00', '00:10:00', '00:15:00', '00:20:00', '00:25:00', '00:30:00', '00:35:00',
'00:40:00', '00:45:00'
]
}],
yAxis: [{
type: 'value' //y轴为值类型
}],
series: [{
name: '环境温度',
type: 'line',
smooth: true,
data: [15, 15, 15, 15, 15, 15, 15, 15, 15, 15]
}]
}
// 为echarts对象加载数据
myChart1.setOption(option1);
myChart2.setOption(option2);
myChart3.setOption(option3);
myChart4.setOption(option4);
//联动配置
myChart1.connect([myChart2, myChart3, myChart4]);
myChart2.connect([myChart1, myChart3, myChart4]);
myChart3.connect([myChart2, myChart1, myChart4]);
myChart4.connect([myChart2, myChart3, myChart1]);
}
}
} ### 题目描述

求解决
回答
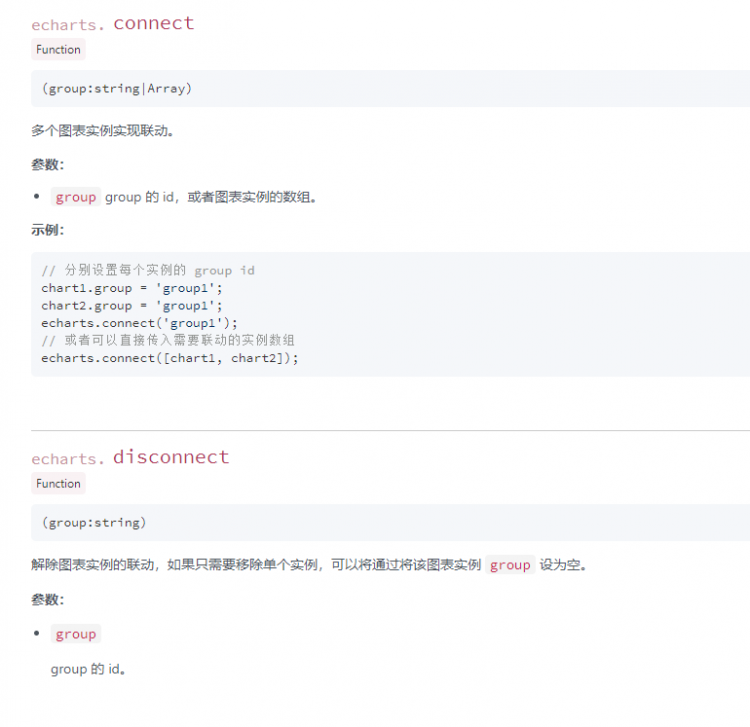
就很神奇,你没看文档介绍怎么用吗

echarts.connect([myChart1, myChart2, myChart3, myChart4]);//你这里应该是
this.$echarts.connect([myChart1, myChart2, myChart3, myChart4]);
以上是 vue 使用echarts的图表进行联动 echarts.connect()方法无效, 的全部内容, 来源链接: utcz.com/a/98518.html


