【java】使用Prometheus自定义指标
1. 自定义指标
为了注册自定义指标,请将MeterRegistry注入到组件中,例如:
public class Dictionary {private final List<String> words = new CopyOnWriteArrayList<>();
Dictionary(MeterRegistry registry) {
registry.gaugeCollectionSize("dictionary.size", Tags.empty(), this.words);
}
// ...
}
如果你的指标依赖于其它bean,那么推荐使用MeterBinder注册这些指标,例如:
@BeanMeterBinder queueSize(Queue queue) {
return (registry) -> Gauge.builder("queueSize", queue::size).register(registry);
}
使用MeterBinder可以确保设置正确的依赖关系,并且在检索指标的值时bean是可用的。默认情况下,来自所有MeterBinder bean的指标将自动绑定到Spring管理的MeterRegistry。如果您发现在组件或应用程序之间重复检测一个指标,那么MeterBinder实现也会很有用。
文档参见

接下来,还是用之前的prometheus-example那个例子,我们来自定义业务指标
重新回顾一下
依赖
<dependency><groupId>org.springframework.boot</groupId>
<artifactId>spring-boot-starter-actuator</artifactId>
</dependency>
<dependency>
<groupId>io.micrometer</groupId>
<artifactId>micrometer-registry-prometheus</artifactId>
<scope>runtime</scope>
</dependency>
application.yml
spring:application:
name: prometheus-example
management:
endpoints:
web:
exposure:
include: "*"
metrics:
tags:
application: ${spring.application.name}
prometheus.yml
scrape_configs:- job_name: 'springboot-prometheus'
metrics_path: '/actuator/prometheus'
static_configs:
- targets: ['192.168.100.93:8080','192.168.100.16:8080']
启动项目
# 启动Prometheus./prometheus --config.file=prometheus.yml
# 启动Grafana
bin/grafana-server web


下面改造一下,新增一个AOP来模拟记录订单相关指标
package com.cjs.example.aop;import com.cjs.example.domain.OrderVO;
import io.micrometer.core.instrument.Counter;
import io.micrometer.core.instrument.DistributionSummary;
import io.micrometer.core.instrument.MeterRegistry;
import org.aspectj.lang.ProceedingJoinPoint;
import org.aspectj.lang.annotation.Around;
import org.aspectj.lang.annotation.Aspect;
import org.aspectj.lang.annotation.Pointcut;
import org.springframework.stereotype.Component;
import javax.annotation.PostConstruct;
/**
* @author ChengJianSheng
* @since 2021/3/8
*/
@Aspect
@Component
public class OrderAspect {
private Counter orderCounter;
private DistributionSummary orderSummary;
public OrderAspect(MeterRegistry registry) {
orderCounter = registry.counter("order_quantity_total", "status", "success");
orderSummary = registry.summary("order_amount_total", "status", "success");
}
// @PostConstruct
// public void init() {
//
// }
@Pointcut("execution(public * com.cjs.example.controller.OrderController.createOrder(..))")
public void pointcut() {
}
@Around("pointcut()")
public Object doAround(ProceedingJoinPoint pjp) throws Throwable {
Object result = pjp.proceed();
OrderVO orderVO = (OrderVO) result;
orderCounter.increment();
orderSummary.record(orderVO.getAmount().doubleValue());
return result;
}
}

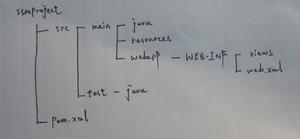
项目结构如图

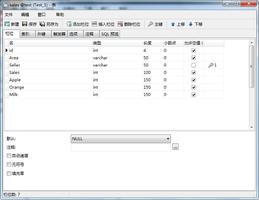
用postman造几条数据

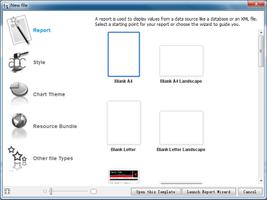
为了好看,我们在Grafana上创建一个dashboard,其中包含4个面板,对应四个指标


输入指标、设置名称、选择视图、设置属性


最后,记得保存。现在,我们有三个仪表盘了


2. 自动发现抓取目标
在实际项目中,我们不可能一个一个手动的配置要抓取的目标,每次都去修改prometheus.yml文件,然后再重启服务,想都不要想,不可能这么做。
为此,我们需要动态发现目标。Prometheus支持很多的服务发现配置,比如:zookeeper、eureka、kubernetes等等
详见 https://prometheus.io/docs/prometheus/latest/configuration/configuration/#scrape_config
这里以Eureka为例,看看Prometheus如何从eureka中动态发现服务
https://prometheus.io/docs/prometheus/latest/configuration/configuration/#eureka_sd_config
https://prometheus.io/docs/prometheus/latest/configuration/configuration/#relabel_config
首先,我们创建一个项目当Eureka Server,并启动它
pom.xml
<?xml version="1.0" encoding="UTF-8"?><project xmlns="http://maven.apache.org/POM/4.0.0" xmlns:xsi="http://www.w3.org/2001/XMLSchema-instance"
xsi:schemaLocation="http://maven.apache.org/POM/4.0.0 https://maven.apache.org/xsd/maven-4.0.0.xsd">
<modelVersion>4.0.0</modelVersion>
<parent>
<groupId>org.springframework.boot</groupId>
<artifactId>spring-boot-starter-parent</artifactId>
<version>2.4.3</version>
<relativePath/> <!-- lookup parent from repository -->
</parent>
<groupId>com.example</groupId>
<artifactId>eureka-server</artifactId>
<version>0.0.1-SNAPSHOT</version>
<name>eureka-server</name>
<properties>
<java.version>1.8</java.version>
<spring-cloud.version>2020.0.1</spring-cloud.version>
</properties>
<dependencies>
<dependency>
<groupId>org.springframework.cloud</groupId>
<artifactId>spring-cloud-starter-netflix-eureka-server</artifactId>
</dependency>
</dependencies>
<dependencyManagement>
<dependencies>
<dependency>
<groupId>org.springframework.cloud</groupId>
<artifactId>spring-cloud-dependencies</artifactId>
<version>${spring-cloud.version}</version>
<type>pom</type>
<scope>import</scope>
</dependency>
</dependencies>
</dependencyManagement>
<build>
<plugins>
<plugin>
<groupId>org.springframework.boot</groupId>
<artifactId>spring-boot-maven-plugin</artifactId>
</plugin>
</plugins>
</build>
</project>
application.yml
server:port: 8761
eureka:
instance:
hostname: localhost
client:
registerWithEureka: false
fetchRegistry: false
serviceUrl:
defaultZone: http://${eureka.instance.hostname}:${server.port}/eureka/
启动类上加@EnableEurekaServer
eureka server 启动以后,接下来,我们改造一下刚才的项目prometheus-example
首先引入eureka client,这样的话完成的pom.xml就变成这样了
<?xml version="1.0" encoding="UTF-8"?><project xmlns="http://maven.apache.org/POM/4.0.0" xmlns:xsi="http://www.w3.org/2001/XMLSchema-instance"
xsi:schemaLocation="http://maven.apache.org/POM/4.0.0 https://maven.apache.org/xsd/maven-4.0.0.xsd">
<modelVersion>4.0.0</modelVersion>
<parent>
<groupId>org.springframework.boot</groupId>
<artifactId>spring-boot-starter-parent</artifactId>
<version>2.4.3</version>
<relativePath/> <!-- lookup parent from repository -->
</parent>
<groupId>com.cjs.example</groupId>
<artifactId>prometheus-example</artifactId>
<version>0.0.1-SNAPSHOT</version>
<name>prometheus-example</name>
<description>Demo project for Spring Boot</description>
<properties>
<java.version>1.8</java.version>
<spring-cloud.version>2020.0.1</spring-cloud.version>
</properties>
<dependencies>
<dependency>
<groupId>org.springframework.boot</groupId>
<artifactId>spring-boot-starter-actuator</artifactId>
</dependency>
<dependency>
<groupId>org.springframework.boot</groupId>
<artifactId>spring-boot-starter-web</artifactId>
</dependency>
<dependency>
<groupId>org.springframework.cloud</groupId>
<artifactId>spring-cloud-starter-netflix-eureka-client</artifactId>
</dependency>
<dependency>
<groupId>io.micrometer</groupId>
<artifactId>micrometer-registry-prometheus</artifactId>
<scope>runtime</scope>
</dependency>
<dependency>
<groupId>org.projectlombok</groupId>
<artifactId>lombok</artifactId>
<optional>true</optional>
</dependency>
<dependency>
<groupId>org.aspectj</groupId>
<artifactId>aspectjweaver</artifactId>
<version>1.9.6</version>
</dependency>
</dependencies>
<dependencyManagement>
<dependencies>
<dependency>
<groupId>org.springframework.cloud</groupId>
<artifactId>spring-cloud-dependencies</artifactId>
<version>${spring-cloud.version}</version>
<type>pom</type>
<scope>import</scope>
</dependency>
</dependencies>
</dependencyManagement>
<build>
<plugins>
<plugin>
<groupId>org.springframework.boot</groupId>
<artifactId>spring-boot-maven-plugin</artifactId>
</plugin>
</plugins>
</build>
</project>
修改application.yml
这里有个地方要注意,原来我们没有加上下文路径(server.servlet.context-path),但是一般项目是会设置的,所以这次我们也加上。
(PS:项目GitHub地址 https://github.com/chengjiansheng/prometheus-example)
完整的配置如下:

server:port: 8080
servlet:
context-path: /hello
spring:
application:
name: prometheus-example
management:
endpoints:
web:
exposure:
include: "*"
metrics:
tags:
application: ${spring.application.name}
eureka:
client:
serviceUrl:
defaultZone: http://192.168.100.93:8761/eureka/
instance:
metadata-map:
"prometheus.scrape": "true"
"prometheus.path": "${server.servlet.context-path}/actuator/prometheus"
"prometheus.port": "${server.port}"
注意:
1、加了server.servlet.context-path以后,抓取的路径就不再是 http://192.168.100.93:8080/actuator/prometheus了,而是变成了 http://192.168.100.93:8080/hello/actuator/prometheus了。之前我们prometheus.yml文件里静态配置抓取目标的metrics_path是/actuator/prometheus,但是现在不能这样写了,因为加了应用上下文路径,而且每个服务都不一样。
2、为了能够根据各服务动态自定义指标路径(metrics_path),最最重要的是下面这三行
eureka:instance:
metadata-map:
"prometheus.scrape": "true"
"prometheus.path": "${server.servlet.context-path}/actuator/prometheus"
"prometheus.port": "${server.port}"
prometheus是通过eureka发现服务的,因此只有将服务的指标路径(抓取地址)写到eureka里,prometheus才能拿到
换言之,只有服务在注册的时候,将自己暴露的端点(endpoint)以元数据的方式写到eureka中prometheus才能正确的从目标抓取数据
修改prometheus.yml,改为通过eureka获取抓取目标
scrape_configs:- job_name: 'eureka-prometheus'
eureka_sd_configs:
- server: http://192.168.100.93:8761/eureka
relabel_configs:
- source_labels: [__meta_eureka_app_instance_metadata_prometheus_path]
action: replace
target_label: __metrics_path__
regex: (.+)

https://github.com/prometheus/prometheus/blob/release-2.25/documentation/examples/prometheus-eureka.yml
https://github.com/prometheus/prometheus/blob/main/documentation/examples/prometheus-eureka.yml
https://github.com/prometheus/prometheus/tree/main/documentation/examples
这里不得不提的是relabel_configs
Relabeling(重新标记)是一种强大的工具,可以在抓取目标之前动态重写目标的标签集。每个抓取配置可以配置多个重新标记步骤。 它们按照在配置文件中出现的顺序应用于每个目标的标签集。
Relabeling是在抓取(scraping)前修改target和它的labels


3. 补充:Prometheus存储
Prometheus自带一个本地磁盘时间序列数据库,但也可以选择与远程存储系统集成。
本地存储
Prometheus的本地时间序列数据库在本地存储上以定制的、高效的格式存储数据。
注意,本地存储的一个限制是它没有集群或副本。因此,在驱动器或节点中断时,它不是任意可伸缩或持久的,应该像任何其他单节点数据库一样进行管理。建议使用RAID来提高存储可用性,建议使用快照作为备份。使用适当的架构,可以在本地存储中保留多年的数据。也可以采用外部存储。
TSDB (时间序列数据库,简称时序数据库)
Prometheus具有几个用于配置本地存储的参数。 最重要的是:
- --storage.tsdb.path: Prometheus写入数据库的位置,默认是data/
- --storage.tsdb.retention.time: 什么时候删除旧数据,默认是15天
- --storage.tsdb.retention.size: 要保留的最大存储块字节数。最旧的数据将首先被删除。默认为0或禁用。这个标志是实验性的,在未来的版本中可能会改变。支持的单位:B、KB、MB、GB、TB、PB、EB。例如:“512 mb”
Prometheus平均每个样本仅存储1~2个字节.因此,要规划Prometheus服务器的容量,可以使用以下公式粗略计算:
needed_disk_space = retention_time_seconds * ingested_samples_per_second * bytes_per_sample
Prometheus通过以下三种方式与远程存储系统集成:
- Prometheus可以将其提取的样本以标准格式写入远程URL
- Prometheus可以以标准格式从其他Prometheus服务器接收样本
- Prometheus可以以标准格式从远程URL读取样本数据

以上是 【java】使用Prometheus自定义指标 的全部内容, 来源链接: utcz.com/a/120668.html