利用Python爬虫爬取天气并数据图形化[python头条资讯]

前言
使用python进行网页数据的爬取现在已经很常见了,而对天气数据的爬取更是入门级的新手操作,很多人学习爬虫都从天气开始,本文便是介绍了从中国天气网爬取天气数据,能够实现输入想要查询的城市,返回该城市未来一周的天气情况,保存为csv文件,并对数据图形化展示分析。最后附完整代码。
1、使用模块
Python3。主要使用到了csv、sys、urllib.request和BeautifulSoup4模块,其中csv模块是为了对csv文件的处理,urllib.request可以构造http请求,BeautifulSoup4可以解析页面信息。在使用这些模块之前,如果不存在需要进行安装,可打开cmd使用pip进行安装。当然,还需要一个城市名与城市code对应的文件,便于我们输入城市后找到对应的code进行相应的天气信息提取。这里点击文件内容cityinfo,可以查看到整理好的城市代码,将该页面内容复制保存为.py文件,然后放入同路径导入即可。
2、根据输入城市从城市代码文件提取到相应的城市代码
cityname = input("请输入你想要查询天气的城市:") if cityname in cityinfo.city:
citycode = cityinfo.city[cityname]
else:
sys.exit()
3、制作请求头,得到请求的应答内容,即页面信息
url = 'http://www.weather.com.cn/weather/' + citycode + '.shtml'header = ("User-Agent","Mozilla/5.0 (Windows NT 10.0; Win64; x64) AppleWebKit/537.36 (KHTML, like Gecko) Chrome/76.0.
3809.132 Safari/537.36") # 设置头部信息
http_handler = urllib.request.HTTPHandler()
opener = urllib.request.build_opener(http_handler) # 修改头部信息
opener.addheaders = [header]
request = urllib.request.Request(url) # 制作请求
response = opener.open(request) # 得到应答包
html = response.read() # 读取应答包
html = html.decode('utf-8') # 设置编码,否则会乱码
其中,设置头部信息header是为了防止某些网站设置了反爬虫,在chrome浏览器下,头部信息header可在浏览器中按f12然后点击network,找到一个请求流,点击请求流后可以看到相应的头部信息。
相关推荐:《Python基础教程》
4、根据返回的页面进行数据的筛选
final = [] # 初始化一个列表保存数据bs = BeautifulSoup(html, "html.parser") # 创建BeautifulSoup对象
body = bs.body # 获取body部分数据
data = body.find('div', {'id': '7d'})
ul = data.find('ul')
li = ul.find_all('li')
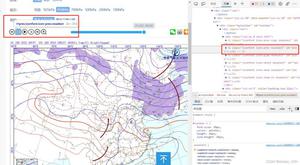
#所有的标签获取内容都根据在页面的所在位置进行筛选,如图所示,我们要查找的未来七天的天气情况都包含在id为7d的div标签中,七天的天气又在这个div的ul中,该div仅有一个ul,因此可使用find方法,每一天的天气又在该ul的li中,且有多个li,则必须使用find_all()方法,找到所有的li,不能使用find方法。
5、爬取数据
i = 0 # 控制爬取的天数lows = [] # 保存低温
highs = [] # 保存高温
for day in li: # 便利找到的每一个li
if i < 7:
temp = []
date = day.find('h1').string # 得到日期
temp.append(date)
inf = day.find_all('p') # 获取天气,遍历li下面的p标签 有多个p需要使用find_all 而不是find
temp.append(inf[0].string)
temlow = inf[1].find('i').string # 最低气温
if inf[1].find('span') is None: # 天气预报有时候可能没有最高气温,需要做一个判断
temhigh = None
temperate = temlow
else:
temhigh = inf[1].find('span').string # 最高气温
temhigh = temhigh.replace('℃', '')
temperate = temhigh + '/' + temlow
temp.append(temperate)
final.append(temp)
i = i + 1
这里是从每个li中获取到每天的天气情况,控制在7天,通过li标签下面的各数据位置进行相应的提取,要注意提取标签的数量,如果在当前标签下有多个相同的提取标签,要使用find_all()而不是find,然后用[n]进行相应的数据提取。
在提取温度时要注意一个问题,中国天气网一般都会显示最高气温和最低气温,但有时候只会显示一个温度,无最高气温,这时就要做一个判断,否则脚本会出错。然后将天气拼接成一个字符串,和其他数据一起放入final列表中。
6、写入csv文件
with open('weather.csv', 'a', errors='ignore', newline='') as f: f_csv = csv.writer(f)
f_csv.writerows([cityname])
f_csv.writerows(final)
最后看到的csv文件中存储的天气数据,如下图所示:
7、使用pygal绘图
使用该模块前需先安装pip install pygal,然后导入import pygal。
bar = pygal.Line() # 创建折线图bar.add('最低气温', lows) #添加两线的数据序列
bar.add('最高气温', highs) #注意lows和highs是int型的列表
bar.x_labels = daytimes
bar.x_labels_major = daytimes[::30]
bar.x_label_rotation = 45
bar.title = cityname+'未来七天气温走向图' #设置图形标题
bar.x_title = '日期' #x轴标题
bar.y_title = '气温(摄氏度)' # y轴标题
bar.legend_at_bottom = True
bar.show_x_guides = False
bar.show_y_guides = True
bar.render_to_file('temperate1.svg') # 将图像保存为SVG文件,可通过浏览器查看
最终生成的图形如下图所示,直观的显示了天气情况:
8、完整代码
import csvimport sys
import urllib.request
from bs4 import BeautifulSoup # 解析页面模块
import pygal
import cityinfo
cityname = input("请输入你想要查询天气的城市:")
if cityname in cityinfo.city:
citycode = cityinfo.city[cityname]
else:
sys.exit()
url = 'http://www.weather.com.cn/weather/' + citycode + '.shtml'
header = ("User-Agent","Mozilla/5.0 (Windows NT 10.0; Win64; x64) AppleWebKit/537.36 (KHTML, like Gecko) Chrome/76.0.
3809.132 Safari/537.36") # 设置头部信息
http_handler = urllib.request.HTTPHandler()
opener = urllib.request.build_opener(http_handler) # 修改头部信息
opener.addheaders = [header]
request = urllib.request.Request(url) # 制作请求
response = opener.open(request) # 得到应答包
html = response.read() # 读取应答包
html = html.decode('utf-8') # 设置编码,否则会乱码
# 根据得到的页面信息进行初步筛选过滤
final = [] # 初始化一个列表保存数据
bs = BeautifulSoup(html, "html.parser") # 创建BeautifulSoup对象
body = bs.body
data = body.find('div', {'id': '7d'})
print(type(data))
ul = data.find('ul')
li = ul.find_all('li')
# 爬取自己需要的数据
i = 0 # 控制爬取的天数
lows = [] # 保存低温
highs = [] # 保存高温
daytimes = [] # 保存日期
weathers = [] # 保存天气
for day in li: # 便利找到的每一个li
if i < 7:
temp = [] # 临时存放每天的数据
date = day.find('h1').string # 得到日期
#print(date)
temp.append(date)
daytimes.append(date)
inf = day.find_all('p') # 遍历li下面的p标签 有多个p需要使用find_all 而不是find
#print(inf[0].string) # 提取第一个p标签的值,即天气
temp.append(inf[0].string)
weathers.append(inf[0].string)
temlow = inf[1].find('i').string # 最低气温
if inf[1].find('span') is None: # 天气预报可能没有最高气温
temhigh = None
temperate = temlow
else:
temhigh = inf[1].find('span').string # 最高气温
temhigh = temhigh.replace('℃', '')
temperate = temhigh + '/' + temlow
# temp.append(temhigh)
# temp.append(temlow)
lowStr = ""
lowStr = lowStr.join(temlow.string)
lows.append(int(lowStr[:-1])) # 以上三行将低温NavigableString转成int类型并存入低温列表
if temhigh is None:
highs.append(int(lowStr[:-1]))
else:
highStr = ""
highStr = highStr.join(temhigh)
highs.append(int(highStr)) # 以上三行将高温NavigableString转成int类型并存入高温列表
temp.append(temperate)
final.append(temp)
i = i + 1
# 将最终的获取的天气写入csv文件
with open('weather.csv', 'a', errors='ignore', newline='') as f:
f_csv = csv.writer(f)
f_csv.writerows([cityname])
f_csv.writerows(final)
# 绘图
bar = pygal.Line() # 创建折线图
bar.add('最低气温', lows)
bar.add('最高气温', highs)
bar.x_labels = daytimes
bar.x_labels_major = daytimes[::30]
# bar.show_minor_x_labels = False # 不显示X轴最小刻度
bar.x_label_rotation = 45
bar.title = cityname+'未来七天气温走向图'
bar.x_title = '日期'
bar.y_title = '气温(摄氏度)'
bar.legend_at_bottom = True
bar.show_x_guides = False
bar.show_y_guides = True
bar.render_to_file('temperate.svg')
以上是 利用Python爬虫爬取天气并数据图形化[python头条资讯] 的全部内容, 来源链接: utcz.com/z/527966.html