Java神奇的32GB

Don’t Cross 32 GB!
There is another reason to not allocate enormous heaps to Elasticsearch. As it turns out, the HotSpot JVM uses a trick to compress object pointers when heaps are less than around 32 GB.
In Java, all objects are allocated on the heap and referenced by a pointer. Ordinary object pointers (OOP) point at these objects, and are traditionally the size of the CPU’s native word: either 32 bits or 64 bits, depending on the processor. The pointer references the exact byte location of the value.
For 32-bit systems, this means the maximum heap size is 4 GB. For 64-bit systems, the heap size can get much larger, but the overhead of 64-bit pointers means there is more wasted space simply because the pointer is larger. And worse than wasted space, the larger pointers eat up more bandwidth when moving values between main memory and various caches (LLC, L1, and so forth).
Java uses a trick called compressed oops to get around this problem. Instead of pointing at exact byte locations in memory, the pointers reference object offsets. This means a 32-bit pointer can reference four billion objects, rather than four billion bytes. Ultimately, this means the heap can grow to around 32 GB of physical size while still using a 32-bit pointer.
Once you cross that magical ~32 GB boundary, the pointers switch back to ordinary object pointers. The size of each pointer grows, more CPU-memory bandwidth is used, and you effectively lose memory. In fact, it takes until around 40–50 GB of allocated heap before you have the same effective memory of a heap just under 32 GB using compressed oops.
The moral of the story is this: even when you have memory to spare, try to avoid crossing the 32 GB heap boundary. It wastes memory, reduces CPU performance, and makes the GC struggle with large heaps.
Just how far under 32gb should I set the JVM?
Unfortunately, that depends. The exact cutoff varies by JVMs and platforms. If you want to play it safe, setting the heap to 31gb is likely safe. Alternatively, you can verify the cutoff point for the HotSpot JVM by adding -XX:+PrintFlagsFinal to your JVM options and checking that the value of the UseCompressedOops flag is true. This will let you find the exact cutoff for your platform and JVM.
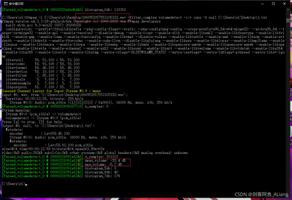
For example, here we test a Java 1.7 installation on MacOSX and see the max heap size is around 32600mb (~31.83gb) before compressed pointers are disabled:
$ JAVA_HOME=`/usr/libexec/java_home -v 1.7` java -Xmx32600m-XX:+PrintFlagsFinal2>/dev/null | grep UseCompressedOopsbool
UseCompressedOops:= true$ JAVA_HOME
=`/usr/libexec/java_home -v 1.7` java -Xmx32766m-XX:+PrintFlagsFinal2>/dev/null | grep UseCompressedOopsbool
UseCompressedOops= false
In contrast, a Java 1.8 installation on the same machine has a max heap size around 32766mb (~31.99gb):
$ JAVA_HOME=`/usr/libexec/java_home -v 1.8` java -Xmx32766m-XX:+PrintFlagsFinal2>/dev/null | grep UseCompressedOopsbool
UseCompressedOops:= true$ JAVA_HOME
=`/usr/libexec/java_home -v 1.8` java -Xmx32767m-XX:+PrintFlagsFinal2>/dev/null | grep UseCompressedOopsbool
UseCompressedOops= false
The moral of the story is that the exact cutoff to leverage compressed oops varies from JVM to JVM, so take caution when taking examples from elsewhere and be sure to check your system with your configuration and JVM.
Beginning with Elasticsearch v2.2.0, the startup log will actually tell you if your JVM is using compressed OOPs or not. You’ll see a log message like:
[2015-12-1613:53:33,417][INFO ][env][IllyanaRasputin] heap size [989.8mb], compressed ordinary object pointers [true]
Which indicates that compressed object pointers are being used. If they are not, the message will say [false].
I Have a Machine with 1 TB RAM!
The 32 GB line is fairly important. So what do you do when your machine has a lot of memory? It is becoming increasingly common to see super-servers with 512–768 GB of RAM.
First, we would recommend avoiding such large machines (see Hardware).
But if you already have the machines, you have two practical options:
- Are you doing mostly full-text search? Consider giving 4-32 GB to Elasticsearch and letting Lucene use the rest of memory via the OS filesystem cache. All that memory will cache segments and lead to blisteringly fast full-text search.
- Are you doing a lot of sorting/aggregations? Are most of your aggregations on numerics, dates, geo_points and
not_analyzedstrings? You’re in luck! Give Elasticsearch somewhere from 4-32 GB of memory and leave the rest for the OS to cache doc values in memory. Are you doing a lot of sorting/aggregations on analyzed strings (e.g. for word-tags, or SigTerms, etc)? Unfortunately that means you’ll need fielddata, which means you need heap space. Instead of one node with more than 512 GB of RAM, consider running two or more nodes on a single machine. Still adhere to the 50% rule, though. So if your machine has 128 GB of RAM, run two nodes, each with just under 32 GB. This means that less than 64 GB will be used for heaps, and more than 64 GB will be left over for Lucene.
If you choose this option, set
cluster.routing.allocation.same_shard.host: truein your config. This will prevent a primary and a replica shard from colocating to the same physical machine (since this would remove the benefits of replica high availability).
以上是 Java神奇的32GB 的全部内容, 来源链接: utcz.com/z/518564.html