使用strace,ltrace寻找故障原因的线索

(1) 了解一个程序的工作原理(可以了解Linux下很多常用的命令实现的原理);
(2) 帮助定位程序中的问题(在开发工作时帮助定位问题);
strace和ltrace的区别:
(1) strace —— Trace system calls and signals (跟踪一个进程的系统调用或信号产生的情况)
(2) ltrace —— A library call tracer (跟踪进程调用库函数的情况)
PS:
n strace最初是为SunOS系统编写的,ltrace最早出现在GUN/Debian Linux中,这两个工具现在已被移植到了大部分Unix系统中(可以通过which命令查找系统中是否存在此命令), 大多数Linux发行版都自带了strace和ltrace,没有的话也可以尝试手动安装它们。
n 关于系统调用和库函数的区别,APUE第一章有详细的介绍。
n strace和ltrace的使用方法基本相同。其中它们共同最常用的三个命令行参数是:
-f
除了跟踪当前进程外,还跟踪其子进程
-o file
将输出信息写到文件file中,而不是显示到标准错误输出(stderr)
-p PID
绑定到一个由PID对应的正在运行的进程,此参数常用来调试后台进程(守护进程)
n strace和ltrace的输出结果格式基本相似。以strace为例,每一行都是一条系统调用(ltrace为库函数),等号左边是系统调用的函数名及其参数,右边是该调用的返回值。
n 此类工具的原理是也大同小异,都是使用ptrace系统调用跟踪调试运行中的进程。
n 用调试工具实时跟踪程序的运行情况,不仅是诊断软件“疑难杂症”的有效手段,也可以帮助我们理清程序的“脉络”,即快速掌握软件的运行流程和工作原理,不失为一种学习源代码的辅助方法。
目录
0 一段简短的介绍... 2
1 strace的基本使用方法... 2
2 使用strace的各种选项—— 进一步帮助定位问题... 4
(1) -i —— 找到地址方便GDB详细调试... 4
(2) -p PID (或 -p `pidof ProcName`) —— attach到进程上,调试后台程序... 5
(3) -o output.log —— 将strace信息输出到文件,方便进一步查找... 7
(4) -f —— 跟踪fork之后的子进程... 8
(5) -t / -tt —— 显示系统调用的执行时刻... 8
(6) -e —— 显示指定跟踪的系统调用... 9
(7) -s —— 指定系统调用参数的长度... 9
3 用strace了解程序的工作原理... 10
4 ltrace的基本使用方法... 12
参考... 13
0 一段简短的介绍
strace is a common tool upon many GNU/Linuxsystems. Put simply strace is a "system call tracer" - which is whereit gets its name from.Using strace, as root, you can monitor the system callsmade by any process upon your system. This can be enormously beneficial whenyou have a misbehaving program.
strace(strace - trace system calls and signals)能够跟踪进程使用的系统调用,并显示其内容。因此,当遇到调试不明的故障时,首先使用strace找出系统调用中出错的地方,通常能得到故障发生的线索,特别是与文件有关的错误、参数错误等。
注意:
使用strace能够有效地发现系统调用失败有关的故障,但无法发现用户写出的程序或共享库中发生的错误。
1 strace的基本使用方法
#include<stdio.h>#include<stdlib.h>intmain(){FILE *fp;fp = fopen("/etc/shadow", "r");if (fp == NULL){printf("Error!");
return EXIT_FAILURE;}return EXIT_SUCCESS;}/*gcc -Wall -g -o st1 st1.c$ ./st1Error!*/
执行该程序报错是因为程序试图打开一般用户没有读权限的/etc/shadow文件,但是通过错误消息无法得知这一点。真实的程序也会有错误信息内容不明确、所有地方都显示同样的错误信息的情况,甚至可能什么都不显示。这种情况下,就很难确定错误发生在源代码的什么地方(通过日志信息可以知道最上层调用出错的地方),因此也无法用GDB设置断点,此时可以使用strace来进一步定位错误。
$ strace ./st1execve("./st1", ["./st1"], [/* 59 vars */]) = 0brk(0) = 0x804a000mmap2(NULL, 4096, PROT_READ|PROT_WRITE, MAP_PRIVATE|MAP_ANONYMOUS, -1, 0) = 0xb7fc4000access("/etc/ld.so.preload", R_OK) = -1 ENOENT (No such file or directory)open("/etc/ld.so.cache", O_RDONLY) = 3fstat64(3, {st_mode=S_IFREG|0644, st_size=37293, ...}) = 0mmap2(NULL, 37293, PROT_READ, MAP_PRIVATE, 3, 0) = 0xb7fba000close(3) = 0open("/lib/libc.so.6", O_RDONLY) = 3// (1)read(3, "177ELF111331340Y1"..., 512) = 512fstat64(3, {st_mode=S_IFREG|0755, st_size=1548470, ...}) = 0mmap2(NULL, 1312188, PROT_READ|PROT_EXEC, MAP_PRIVATE|MAP_DENYWRITE, 3, 0) = 0xb7e79000madvise(0xb7e79000, 1312188, MADV_SEQUENTIAL|0x1) = 0mmap2(0xb7fb3000, 16384, PROT_READ|PROT_WRITE, MAP_PRIVATE|MAP_FIXED|MAP_DENYWRITE, 3, 0x139) = 0xb7fb3000mmap2(0xb7fb7000, 9660, PROT_READ|PROT_WRITE, MAP_PRIVATE|MAP_FIXED|MAP_ANONYMOUS, -1, 0) = 0xb7fb7000close(3) = 0mmap2(NULL, 4096, PROT_READ|PROT_WRITE, MAP_PRIVATE|MAP_ANONYMOUS, -1, 0) = 0xb7e78000set_thread_area({entry_number:-1 -> 6, base_addr:0xb7e786b0, limit:1048575, seg_32bit:1, contents:0, read_exec_only:0, limit_in_pages:1, seg_not_present:0, useable:1}) = 0mprotect(0xb7fb3000, 8192, PROT_READ) = 0munmap(0xb7fba000, 37293) = 0brk(0) = 0x804a000brk(0x806b000) = 0x806b000open("/etc/shadow", O_RDONLY) = -1 EACCES (Permission denied) // (2)fstat64(1, {st_mode=S_IFCHR|0620, st_rdev=makedev(136, 0), ...}) = 0mmap2(NULL, 4096, PROT_READ|PROT_WRITE, MAP_PRIVATE|MAP_ANONYMOUS, -1, 0) = 0xb7fc3000write(1, "Error!", 7Error! // (3)
) = 7exit_group(1) = ?Process 22259 detached
出错并结束的话,从后往前看strace的输出结果是解决问题的捷径。从标注的位置可以发现,最后即为在界面上显示错误信息的系统调用,再往前看,系统调用open()失败,而且立即可以得知程序在试图打开/etc/shadow时发生了Permission denied错误(EACCES)。
PS:
上面strace显示的信息有很多,但开头的信息都是关于启动进程时的处理。尽管这一部分有很多错误,但这些错误是进程在试图从各种路径中加载共享库而导致的。从
open("/lib/libc.so.6",O_RDONLY) = 3
处开始的十几行,程序成功地将所有的库链接到了进程,附近都是运行时加载器(runtime loader)的处理,可以忽略。
2 使用strace的各种选项 —— 进一步帮助定位问题
下面介绍一些常用的选项,详细内容见 man strace
(1) -i ——找到地址方便GDB详细调试
Print the instruction pointer at the timeof the system call.
给strace添加 -i 选项即可显示程序在哪个地址进行了系统调用,可以将该地址作为断点使用,然后使用GDB进一步定位问题。
$ strace -i ./st1[b7e44d2a] execve("./st1", ["./st1"], [/* 59 vars */]) = 0[b7fdf6bb] brk(0) = 0x804a000[b7fe04c3] mmap2(NULL, 4096, PROT_READ|PROT_WRITE, MAP_PRIVATE|MAP_ANONYMOUS, -1, 0) = 0xb7fcb000[b7fe0041] access("/etc/ld.so.preload", R_OK) = -1 ENOENT (No such file or directory)[b7fdff04] open("/etc/ld.so.cache", O_RDONLY) = 3[b7fdfece] fstat64(3, {st_mode=S_IFREG|0644, st_size=37293, ...}) = 0[b7fe04c3] mmap2(NULL, 37293, PROT_READ, MAP_PRIVATE, 3, 0) = 0xb7fc1000[b7fdff3d] close(3) = 0[b7fdff04] open("/lib/libc.so.6", O_RDONLY) = 3[b7fdff84] read(3, "177ELF111331340Y1"..., 512) = 512[b7fdfece] fstat64(3, {st_mode=S_IFREG|0755, st_size=1548470, ...}) = 0[b7fe04c3] mmap2(NULL, 1312188, PROT_READ|PROT_EXEC, MAP_PRIVATE|MAP_DENYWRITE, 3, 0) = 0xb7e80000[b7fe0584] madvise(0xb7e80000, 1312188, MADV_SEQUENTIAL|0x1) = 0[b7fe04c3] mmap2(0xb7fba000, 16384, PROT_READ|PROT_WRITE, MAP_PRIVATE|MAP_FIXED|MAP_DENYWRITE, 3, 0x139) = 0xb7fba000[b7fe04c3] mmap2(0xb7fbe000, 9660, PROT_READ|PROT_WRITE, MAP_PRIVATE|MAP_FIXED|MAP_ANONYMOUS, -1, 0) = 0xb7fbe000[b7fdff3d] close(3) = 0[b7fe04c3] mmap2(NULL, 4096, PROT_READ|PROT_WRITE, MAP_PRIVATE|MAP_ANONYMOUS, -1, 0) = 0xb7e7f000[b7fcdce0] set_thread_area({entry_number:-1 -> 6, base_addr:0xb7e7f6b0, limit:1048575, seg_32bit:1, contents:0, read_exec_only:0, limit_in_pages:1, seg_not_present:0, useable:1}) = 0[b7fe0544] mprotect(0xb7fba000, 8192, PROT_READ) = 0[b7fe0501] munmap(0xb7fc1000, 37293) = 0[b7f3855b] brk(0) = 0x804a000[b7f3855b] brk(0x806b000) = 0x806b000[b7f304be] open("/etc/shadow", O_RDONLY) = -1 EACCES (Permission denied)[b7f2f57e] fstat64(1, {st_mode=S_IFCHR|0620, st_rdev=makedev(136, 0), ...}) = 0[b7f3c5f3] mmap2(NULL, 4096, PROT_READ|PROT_WRITE, MAP_PRIVATE|MAP_ANONYMOUS, -1, 0) = 0xb7fca000[b7f30b8e] write(1, "Error!", 7Error!
) = 7[b7f0bcf3] exit_group(1) = ?Process 17355 detached
各行开头[]中的数字就是执行系统调用的代码的地址。在GDB中可以指定该地址并显示backstrace。
(2) -p PID (或 -p `pidof ProcName`) —— attach到进程上,调试后台程序
Attach to the process with the process ID pid and begin tracing. The trace may be terminated at any time by a keyboard interrupt signal (CTRL-C). strace will respond by detaching itself from the traced process(es) leaving it (them) to continue running. Multiple -p options can be used to attach to up to 32 processes in addition to command (which is optional if at least one -p option is given).
此选项主要用于查看运行中的进程(如守护进程)的行为。将上面的程序做一下修改:
#include<stdio.h>#include<stdlib.h>#include<unistd.h>intmain(){while(1){FILE *fp;fp = fopen("/etc/shadow", "r");if (fp == NULL){printf("Error!");
//return EXIT_FAILURE;}else{fclose(fp);}sleep(3);// sleep 3 seconds}return EXIT_SUCCESS;}/*gcc -Wall -g -o st1 st1_p260.c*/
ps ux | grep st1
1006 17673 0.0 0.0 1640 348 pts/0 S+ 10:21 0:00 ./st1
使用 -p 选项跟踪当前正在运行的程序,按Ctrl-C键来结束程序。
$ strace -p 17673Process 17673 attached - interrupt to quitrestart_syscall(<... resuming interrupted call ...>) = 0open("/etc/shadow", O_RDONLY) = -1 EACCES (Permission denied)write(1, "Error!", 7) = 7
rt_sigprocmask(SIG_BLOCK, [CHLD], [], 8) = 0rt_sigaction(SIGCHLD, NULL, {SIG_DFL}, 8) = 0rt_sigprocmask(SIG_SETMASK, [], NULL, 8) = 0nanosleep({3, 0}, {3, 0}) = 0open("/etc/shadow", O_RDONLY) = -1 EACCES (Permission denied)write(1, "Error!", 7) = 7
rt_sigprocmask(SIG_BLOCK, [CHLD], [], 8) = 0rt_sigaction(SIGCHLD, NULL, {SIG_DFL}, 8) = 0rt_sigprocmask(SIG_SETMASK, [], NULL, 8) = 0nanosleep({3, 0}, {3, 0}) = 0open("/etc/shadow", O_RDONLY) = -1 EACCES (Permission denied)write(1, "Error!", 7) = 7
rt_sigprocmask(SIG_BLOCK, [CHLD], [], 8) = 0rt_sigaction(SIGCHLD, NULL, {SIG_DFL}, 8) = 0rt_sigprocmask(SIG_SETMASK, [], NULL, 8) = 0nanosleep({3, 0}, <unfinished ...>Process 17673 detached// 或者使用$ strace -p `pidof st1`Process 17673 attached - interrupt to quitrestart_syscall(<... resuming interrupted call ...>) = 0open("/etc/shadow", O_RDONLY) = -1 EACCES (Permission denied)write(1, "Error!", 7) = 7
rt_sigprocmask(SIG_BLOCK, [CHLD], [], 8) = 0rt_sigaction(SIGCHLD, NULL, {SIG_DFL}, 8) = 0rt_sigprocmask(SIG_SETMASK, [], NULL, 8) = 0nanosleep({3, 0}, {3, 0}) = 0open("/etc/shadow", O_RDONLY) = -1 EACCES (Permission denied)write(1, "Error!", 7) = 7
rt_sigprocmask(SIG_BLOCK, [CHLD], [], 8) = 0rt_sigaction(SIGCHLD, NULL, {SIG_DFL}, 8) = 0rt_sigprocmask(SIG_SETMASK, [], NULL, 8) = 0nanosleep({3, 0}, <unfinished ...>Process 17673 detached
(3) -o output.log ——将strace信息输出到文件,方便进一步查找
Write the trace output to the file ‘’filename‘’ rather than to stderr. Use filename.pid if -ff is used. If the argument begins with "|" or with "!" then the rest of the argument is treated as a command and all output is piped to it. This is convenient for piping the debugging output to a program without affecting the redirections of executed programs.
If the -o filename option is in effect,each processes trace is written to filename.pid where pid is the numeric process id of each process.
$ strace -o output.log ./st1$ cat output.logexecve("./st1", ["./st1"], [/* 59 vars */]) = 0brk(0) = 0x804a000mmap2(NULL, 4096, PROT_READ|PROT_WRITE, MAP_PRIVATE|MAP_ANONYMOUS, -1, 0) = 0xb7f2e000access("/etc/ld.so.preload", R_OK) = -1 ENOENT (No such file or directory)
注意:strace的输出为标准错误输出,因此可以像下面这样将显示内容输出到标准输出上,通过管道再传给grep、less等。
$ strace ./st1 2>&1| grep openopen("/etc/ld.so.cache", O_RDONLY) = 3open("/lib/libc.so.6", O_RDONLY) = 3open("/etc/shadow", O_RDONLY) = -1 EACCES (Permission denied)open("/etc/shadow", O_RDONLY) = -1 EACCES (Permission denied)open("/etc/shadow", O_RDONLY) = -1 EACCES (Permission denied)open("/etc/shadow", O_RDONLY) = -1 EACCES (Permission denied)
PS:
2>&1 将标准出错重定向到标准输出
2> 代表错误重定向
&1 代表标准输出
(4) -f ——跟踪fork之后的子进程
Trace child processes as they are created by currently traced processes as a result of the fork(2) system call. The new process is attached to as soon as its pid is known (through the return value of fork(2) in the parent process).This means that such children may run uncontrolled for awhile (especially in the case of a fork(2)), until the parent is scheduled again to complete its (v)fork(2) call. If the parent process decides to wait(2) for a child that is currently being traced, it is suspended until an appropriate child process either terminates or incurs a signal that would cause it to terminate (as determined from the child"s current signal disposition).
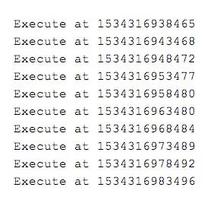
(5) -t / -tt ——显示系统调用的执行时刻
-t 以秒为单位
-tt 以毫秒为单位
-t Prefix each line of the trace with the time of day.
-tt If given twice, the time printed will include the microseconds.
-ttt If given thrice, the time printed will include the microseconds and the leading portion will be printed as the number of seconds since theepoch.
-T Show the time spent in system calls. This records the time difference between the beginning and the end of each system call.
(6) -e ——显示指定跟踪的系统调用
-e expr
A qualifying expression which modifies which events to trace or how to trace them. The format of the expression is:
[qualifier=][!]value1[,value2]...
where qualifier is one of trace, abbrev,verbose, raw, signal, read, or write and value is a qualifier-dependent symbol or number. The default qualifier is trace. Using an exclamation mark negates the set of values. For example, -e open means literally -e trace=open which in turn means trace only the open system call. By contrast,-e trace=!open means to trace every system call except open. In addition, the special values all and none have the obvious meanings.
Note that some shells use the exclamation point for history expansion even inside quoted arguments. If so, you must escape the exclamation point with a backslash.
例如:
(1) 只记录open的系统调用
$ strace -e trace=open ./st1open("/etc/ld.so.cache", O_RDONLY) = 3open("/lib/libc.so.6", O_RDONLY) = 3open("/etc/shadow", O_RDONLY) = -1 EACCES (Permission denied)Error!open("/etc/shadow", O_RDONLY) = -1 EACCES (Permission denied)Error!
(2) 另外:
-e trace=all 跟踪进程的所有系统调用
-e trace=network 只记录和网络api相关的系统调用
-e trace=file 只记录涉及到文件名的系统调用
-e trace=desc 只记录涉及到文件句柄的系统调用
其他的还包括:process,ipc, signal等。
(7) -s ——指定系统调用参数的长度
显示系统调用参数时,对于字符串显示的长度, 默认是32,如果字符串参数很长,很多信息显示不出来。
-s strsize
Specify the maximum string size to print(the default is 32). Note that filenames are not considered strings and are always printed in full.
例如:
strace -s 1024 ./st1
3 用strace了解程序的工作原理
问题:在进程内打开一个文件,都有唯一一个文件描述符(fd: file descriptor)与这个文件对应。如果已知一个fd,如何获取这个fd所对应文件的完整路径?不管是Linux、FreeBSD或其他Unix系统都没有提供这样的API,那怎么办呢?
我们换个角度思考:Unix下有没有什么命令可以获取进程打开了哪些文件?使用 lsof 命令即可以知道程序打开了哪些文件,也可以了解一个文件被哪个进程打开。(平时工作中很常用,例如,使用 lsof -p PID来查找某个进程存放的位置)
#include<stdio.h>#include<unistd.h>#include<sys/types.h>#include<sys/stat.h>#include<fcntl.h>intmain(){open("wcdj", O_CREAT|O_RDONLY);// open file foosleep(1200);// sleep 20 mins 方便调试return0;}/*gcc -Wall -g -o testlsof testlsof.c./testlsof &*/$ gcc -Wall -g -o testlsof testlsof.c$ ./testlsof &[1] 12371$ strace -o lsof.strace lsof -p 12371COMMAND PID USER FD TYPE DEVICE SIZE NODE NAMEtestlsof 12371 gerryyang cwd DIR 8,440962359314 /data/home/gerryyang/test/HACKtestlsof 12371 gerryyang rtd DIR 8,140962 /testlsof 12371 gerryyang txt REG 8,477392359364 /data/home/gerryyang/test/HACK/testlsoftestlsof 12371 gerryyang mem REG 8,115484701117263 /lib/libc-2.4.sotestlsof 12371 gerryyang mem REG 8,11290401117255 /lib/ld-2.4.sotestlsof 12371 gerryyang mem REG 0,00 [stack] (stat: No such file or directory)testlsof 12371 gerryyang 0u CHR 136,02 /dev/pts/0testlsof 12371 gerryyang 1u CHR 136,02 /dev/pts/0testlsof 12371 gerryyang 2u CHR 136,02 /dev/pts/0testlsof 12371 gerryyang 3r REG 8,402359367 /data/home/gerryyang/test/HACK/wcdj$ grep "wcdj" lsof.stracereadlink("/proc/12371/fd/3", "/data/home/gerryyang/test/HACK/wcdj", 4096) = 35$ cd /proc/12371/fd$ ls -l总计 4lrwx------ 1 gerryyang users 642012-03-2314:140 -> /dev/pts/0lrwx------ 1 gerryyang users 642012-03-2314:141 -> /dev/pts/0lrwx------ 1 gerryyang users 642012-03-2314:142 -> /dev/pts/0lr-x------ 1 gerryyang users 642012-03-2314:143 -> /data/home/gerryyang/test/HACK/wcdj
用strace跟踪lsof的运行,输出结果保存在lsof.strace中。然后通过对lsof.strace内容的分析
从而了解到其实现原理是:
lsof利用了/proc/pid/fd目录。Linux内核会为每一个进程在/proc建立一个以其pid为名的目录用来保存进程的相关信息,而其子目录fd保存的是该进程打开的所有文件的fd。进入/proc/pid/fd目录下,发现每一个fd文件都是符号链接,而此链接就指向被该进程打开的一个文件。我们只要用readlink()系统调用就可以获取某个fd对应的文件了。
#include<stdio.h>#include<string.h>#include<sys/types.h>#include<unistd.h>// readlink#include<fcntl.h>#include<sys/stat.h>intget_pathname_from_fd(int fd, char pathname[], int n){char buf[1024];pid_t pid;bzero(buf, 1024);pid = getpid();snprintf(buf, 1024, "/proc/%i/fd/%i", pid, fd);// %i == %dreturn readlink(buf, pathname, n);}intmain(){int fd;char pathname[4096] = {0};bzero(pathname, 4096);fd = open("wcdj", O_RDONLY);get_pathname_from_fd(fd, pathname, 4096);printf("fd=%d; pathname=%s", fd, pathname);
return0;}/*gcc -Wall -g -o GetPathByFd GetPathByFd.c*/
4 ltrace的基本使用方法
ltrace - A library call tracer
$ ltrace ./st1__libc_start_main(0x8048494, 1, 0xbfe4a204, 0x8048500, 0x80484f0 <unfinished ...>fopen("r", "r") = 0puts("r"Error!) = 7sleep(3) = 0fopen("r", "r") = 0puts("r"Error!) = 7sleep(3) = 0fopen("r", "r") = 0puts("r"Error!) = 7sleep(3 <unfinished ...>--- SIGINT (Interrupt) ---+++ killed by SIGINT +++
参考
[1] DEBUG HACKS P.259
[2] strace(1) - Linux man page
http://linux.die.net/man/1/strace
[3]Debugging Tip: Trace the Process and SeeWhat It is Doing with strace
http://www.cyberciti.biz/tips/linux-strace-command-examples.html
[4] 技巧: 使用truss、strace或ltrace诊断软件的"疑难杂症"
http://www.ibm.com/developerworks/cn/linux/l-tsl/index.html
[5] 使用 Strace 和 GDB 调试工具的乐趣
http://www.ibm.com/developerworks/cn/aix/library/au-unix-strace.html
以上是 使用strace,ltrace寻找故障原因的线索 的全部内容, 来源链接: utcz.com/z/517985.html