基于SpringBoot2.0+Actuatormetrics的监控

引言
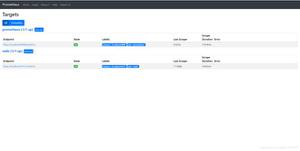
SpringBoot2在spring-boot-actuator中引入了micrometer,对1.x的metrics进行了重构,另外支持对接的监控系统也更加丰富(Atlas、Datadog、Ganglia、Graphite、Influx、JMX、NewRelic、Prometheus、SignalFx、StatsD、Wavefront)。本文以Prometheus为例阐述SpringBoot2.0的监控。
eg. Prometheus
Maven坐标
<dependency><groupId>org.springframework.boot</groupId>
<artifactId>spring-boot-starter-actuator</artifactId>
</dependency>
<dependency>
<groupId>io.micrometer</groupId>
<artifactId>micrometer-registry-prometheus</artifactId>
</dependency>
配置信息
management.endpoints.web.exposure.include=*Prometheus地址
http://ip:port/demo-prometheus/actuator/prometheus
# HELP tomcat_global_sent_bytes_total # TYPE tomcat_global_sent_bytes_total counter
tomcat_global_sent_bytes_total{name="http-nio-10101",}5925847.0
# HELP process_start_time_seconds The start time of the Java virtual machine
# TYPE process_start_time_seconds gauge
process_start_time_seconds 1.523875107155E9
# HELP tomcat_sessions_created_total
# TYPE tomcat_sessions_created_total counter
tomcat_sessions_created_total 0.0
# HELP tomcat_global_request_max_seconds
# TYPE tomcat_global_request_max_seconds gauge
tomcat_global_request_max_seconds{name="http-nio-10101",}60.17
# HELP process_cpu_usage The "recent cpu usage" for the Java Virtual Machine process
# TYPE process_cpu_usage gauge
process_cpu_usage 0.012943162633652222
# HELP jvm_threads_daemon The current number of live daemon threads
# TYPE jvm_threads_daemon gauge
jvm_threads_daemon 64.0
# HELP jvm_memory_committed_bytes The amount of memory in bytes that is committed for the Java virtual machine to use
# TYPE jvm_memory_committed_bytes gauge
jvm_memory_committed_bytes{area="nonheap",id="CodeHeap "non-nmethods"",}2555904.0
jvm_memory_committed_bytes{area="nonheap",id="Metaspace",}8.9419776E7
jvm_memory_committed_bytes{area="nonheap",id="CodeHeap "profiled nmethods"",}2.5165824E7
jvm_memory_committed_bytes{area="nonheap",id="Compressed Class Space",}1.1087872E7
jvm_memory_committed_bytes{area="heap",id="G1 Eden Space",}6.54311424E8
jvm_memory_committed_bytes{area="heap",id="G1 Old Gen",}3.97410304E8
jvm_memory_committed_bytes{area="heap",id="G1 Survivor Space",}2.2020096E7
jvm_memory_committed_bytes{area="nonheap",id="CodeHeap "non-profiled nmethods"",}8650752.0
# HELP system_cpu_usage The "recent cpu usage" for the whole system
# TYPE system_cpu_usage gauge
system_cpu_usage 0.009003939223410242
# HELP tomcat_threads_config_max
# TYPE tomcat_threads_config_max gauge
tomcat_threads_config_max{name="http-nio-10101",}200.0
# HELP tomcat_sessions_active_current
# TYPE tomcat_sessions_active_current gauge
tomcat_sessions_active_current 0.0
# HELP tomcat_cache_hit_total
# TYPE tomcat_cache_hit_total counter
tomcat_cache_hit_total 0.0
# HELP tomcat_sessions_rejected_total
# TYPE tomcat_sessions_rejected_total counter
tomcat_sessions_rejected_total 0.0
# HELP jvm_threads_live The current number of live threads including both daemon and non-daemon threads
# TYPE jvm_threads_live gauge
jvm_threads_live 68.0
# HELP jvm_classes_loaded The number of classes that are currently loaded in the Java virtual machine
# TYPE jvm_classes_loaded gauge
jvm_classes_loaded 14846.0
# HELP jvm_gc_pause_seconds Time spent in GC pause
# TYPE jvm_gc_pause_seconds summary
jvm_gc_pause_seconds_count{action="end of minor GC",cause="Metadata GC Threshold",}1.0
jvm_gc_pause_seconds_sum{action="end of minor GC",cause="Metadata GC Threshold",}0.047
jvm_gc_pause_seconds_max{action="end of minor GC",cause="Metadata GC Threshold",}0.0
jvm_gc_pause_seconds_count{action="end of minor GC",cause="G1 Evacuation Pause",}3.0
jvm_gc_pause_seconds_sum{action="end of minor GC",cause="G1 Evacuation Pause",}0.105
jvm_gc_pause_seconds_max{action="end of minor GC",cause="G1 Evacuation Pause",}0.0
# HELP jvm_gc_memory_allocated_bytes_total Incremented for an increase in the size of the young generation memory pool after one GC to before the next
# TYPE jvm_gc_memory_allocated_bytes_total counter
jvm_gc_memory_allocated_bytes_total 1.0030608E7
# HELP tomcat_servlet_request_seconds
# TYPE tomcat_servlet_request_seconds summary
tomcat_servlet_request_seconds_count{name="default",}0.0
tomcat_servlet_request_seconds_sum{name="default",}0.0
# HELP jvm_buffer_total_capacity_bytes An estimate of the total capacity of the buffers in this pool
# TYPE jvm_buffer_total_capacity_bytes gauge
jvm_buffer_total_capacity_bytes{id="mapped",}0.0
jvm_buffer_total_capacity_bytes{id="direct",}6.7427031E7
# HELP process_uptime_seconds The uptime of the Java virtual machine
# TYPE process_uptime_seconds gauge
process_uptime_seconds 244011.477
# HELP tomcat_sessions_expired_total
# TYPE tomcat_sessions_expired_total counter
tomcat_sessions_expired_total 0.0
# HELP tomcat_sessions_active_max
# TYPE tomcat_sessions_active_max gauge
tomcat_sessions_active_max 0.0
# HELP jvm_gc_memory_promoted_bytes_total Count of positive increases in the size of the old generation memory pool before GC to after GC
# TYPE jvm_gc_memory_promoted_bytes_total counter
jvm_gc_memory_promoted_bytes_total 0.0
# HELP tomcat_sessions_alive_max_seconds
# TYPE tomcat_sessions_alive_max_seconds gauge
tomcat_sessions_alive_max_seconds 0.0
# HELP tomcat_global_error_total
# TYPE tomcat_global_error_total counter
tomcat_global_error_total{name="http-nio-10101",}16.0
# HELP tomcat_threads_busy
# TYPE tomcat_threads_busy gauge
tomcat_threads_busy{name="http-nio-10101",}0.0
# HELP system_load_average_1m The sum of the number of runnable entities queued to available processors and the number of runnable entities running on the available processors averaged over a period of time
# TYPE system_load_average_1m gauge
system_load_average_1m 0.0
# HELP process_files_open The open file descriptor count
# TYPE process_files_open gauge
process_files_open 142.0
# HELP system_cpu_count The number of processors available to the Java virtual machine
# TYPE system_cpu_count gauge
system_cpu_count 4.0
# HELP jvm_gc_max_data_size_bytes Max size of old generation memory pool
# TYPE jvm_gc_max_data_size_bytes gauge
jvm_gc_max_data_size_bytes -1.0
# HELP tomcat_cache_access_total
# TYPE tomcat_cache_access_total counter
tomcat_cache_access_total 0.0
# HELP http_server_requests_seconds
# TYPE http_server_requests_seconds summary
http_server_requests_seconds_count{exception="None",method="GET",status="200",uri="/**",}3.0
http_server_requests_seconds_sum{exception="None",method="GET",status="200",uri="/**",}0.024679861
http_server_requests_seconds_max{exception="None",method="GET",status="200",uri="/**",}0.0
http_server_requests_seconds_count{exception="None",method="GET",status="200",uri="/webjars/**",}31.0
http_server_requests_seconds_sum{exception="None",method="GET",status="200",uri="/webjars/**",}2.672684295
http_server_requests_seconds_max{exception="None",method="GET",status="200",uri="/webjars/**",}0.0
http_server_requests_seconds_count{exception="None",method="GET",status="200",uri="/swagger-resources/configuration/ui",}3.0
http_server_requests_seconds_sum{exception="None",method="GET",status="200",uri="/swagger-resources/configuration/ui",}0.075265631
http_server_requests_seconds_max{exception="None",method="GET",status="200",uri="/swagger-resources/configuration/ui",}0.0
http_server_requests_seconds_count{exception="None",method="GET",status="200",uri="/swagger-resources/configuration/security",}3.0
http_server_requests_seconds_sum{exception="None",method="GET",status="200",uri="/swagger-resources/configuration/security",}0.013461829
http_server_requests_seconds_max{exception="None",method="GET",status="200",uri="/swagger-resources/configuration/security",}0.0
http_server_requests_seconds_count{exception="None",method="GET",status="200",uri="/swagger-resources",}3.0
http_server_requests_seconds_sum{exception="None",method="GET",status="200",uri="/swagger-resources",}0.013547926
http_server_requests_seconds_max{exception="None",method="GET",status="200",uri="/swagger-resources",}0.0
http_server_requests_seconds_count{exception="None",method="GET",status="200",uri="root",}10.0
http_server_requests_seconds_sum{exception="None",method="GET",status="200",uri="root",}0.178656116
http_server_requests_seconds_max{exception="None",method="GET",status="200",uri="root",}0.0
http_server_requests_seconds_count{exception="None",method="GET",status="404",uri="NOT_FOUND",}7.0
http_server_requests_seconds_sum{exception="None",method="GET",status="404",uri="NOT_FOUND",}0.013102879
http_server_requests_seconds_max{exception="None",method="GET",status="404",uri="NOT_FOUND",}0.0
http_server_requests_seconds_count{exception="None",method="GET",status="304",uri="REDIRECTION",}10.0
http_server_requests_seconds_sum{exception="None",method="GET",status="304",uri="REDIRECTION",}0.020565319
http_server_requests_seconds_max{exception="None",method="GET",status="304",uri="REDIRECTION",}0.0
http_server_requests_seconds_count{exception="None",method="GET",status="200",uri="/v1/serial/number",}88.0
http_server_requests_seconds_sum{exception="None",method="GET",status="200",uri="/v1/serial/number",}0.987564415
http_server_requests_seconds_max{exception="None",method="GET",status="200",uri="/v1/serial/number",}0.0
http_server_requests_seconds_count{exception="QueryTimeoutException",method="GET",status="200",uri="/v1/serial/number",}6.0
http_server_requests_seconds_sum{exception="QueryTimeoutException",method="GET",status="200",uri="/v1/serial/number",}360.059517815
http_server_requests_seconds_max{exception="QueryTimeoutException",method="GET",status="200",uri="/v1/serial/number",}0.0
# HELP jvm_buffer_memory_used_bytes An estimate of the memory that the Java virtual machine is using for this buffer pool
# TYPE jvm_buffer_memory_used_bytes gauge
jvm_buffer_memory_used_bytes{id="mapped",}0.0
jvm_buffer_memory_used_bytes{id="direct",}6.7427032E7
# HELP jvm_classes_unloaded_total The total number of classes unloaded since the Java virtual machine has started execution
# TYPE jvm_classes_unloaded_total counter
jvm_classes_unloaded_total 0.0
# HELP tomcat_servlet_request_max_seconds
# TYPE tomcat_servlet_request_max_seconds gauge
tomcat_servlet_request_max_seconds{name="default",}0.0
# HELP jvm_memory_used_bytes The amount of used memory
# TYPE jvm_memory_used_bytes gauge
jvm_memory_used_bytes{area="nonheap",id="CodeHeap "non-nmethods"",}1414400.0
jvm_memory_used_bytes{area="nonheap",id="Metaspace",}8.373908E7
jvm_memory_used_bytes{area="nonheap",id="CodeHeap "profiled nmethods"",}2.4729472E7
jvm_memory_used_bytes{area="nonheap",id="Compressed Class Space",}1.0082712E7
jvm_memory_used_bytes{area="heap",id="G1 Eden Space",}5.74619648E8
jvm_memory_used_bytes{area="heap",id="G1 Old Gen",}3.557784E7
jvm_memory_used_bytes{area="heap",id="G1 Survivor Space",}2.2020096E7
jvm_memory_used_bytes{area="nonheap",id="CodeHeap "non-profiled nmethods"",}8617856.0
# HELP tomcat_servlet_error_total
# TYPE tomcat_servlet_error_total counter
tomcat_servlet_error_total{name="default",}0.0
# HELP jvm_memory_max_bytes The maximum amount of memory in bytes that can be used for memory management
# TYPE jvm_memory_max_bytes gauge
jvm_memory_max_bytes{area="nonheap",id="CodeHeap "non-nmethods"",}5832704.0
jvm_memory_max_bytes{area="nonheap",id="Metaspace",}-1.0
jvm_memory_max_bytes{area="nonheap",id="CodeHeap "profiled nmethods"",}1.22912768E8
jvm_memory_max_bytes{area="nonheap",id="Compressed Class Space",}1.073741824E9
jvm_memory_max_bytes{area="heap",id="G1 Eden Space",}-1.0
jvm_memory_max_bytes{area="heap",id="G1 Old Gen",}1.073741824E9
jvm_memory_max_bytes{area="heap",id="G1 Survivor Space",}-1.0
jvm_memory_max_bytes{area="nonheap",id="CodeHeap "non-profiled nmethods"",}1.22912768E8
# HELP tomcat_global_received_bytes_total
# TYPE tomcat_global_received_bytes_total counter
tomcat_global_received_bytes_total{name="http-nio-10101",}0.0
# HELP tomcat_global_request_seconds
# TYPE tomcat_global_request_seconds summary
tomcat_global_request_seconds_count{name="http-nio-10101",}168.0
tomcat_global_request_seconds_sum{name="http-nio-10101",}368.401
# HELP tomcat_threads_current
# TYPE tomcat_threads_current gauge
tomcat_threads_current{name="http-nio-10101",}10.0
# HELP jvm_gc_live_data_size_bytes Size of old generation memory pool after a full GC
# TYPE jvm_gc_live_data_size_bytes gauge
jvm_gc_live_data_size_bytes 0.0
# HELP jvm_buffer_count An estimate of the number of buffers in the pool
# TYPE jvm_buffer_count gauge
jvm_buffer_count{id="mapped",}0.0
jvm_buffer_count{id="direct",}108.0
# HELP process_files_max The maximum file descriptor count
# TYPE process_files_max gauge
process_files_max 8192.0
# HELP jvm_threads_peak The peak live thread count since the Java virtual machine started or peak was reset
# TYPE jvm_threads_peak gauge
jvm_threads_peak 68.0
SpringBoot2.0 Actuator监控指标分析
---
JVM
---
1
jvm.memory.max
JVM最大内存
2
jvm.memory.committed
JVM可用内存
是
展示并监控堆内存和Metaspace
重要
3
jvm.memory.used
JVM已用内存
是
展示并监控堆内存和Metaspace
重要
4
jvm.buffer.memory.used
JVM缓冲区已用内存
5
jvm.buffer.count
当前缓冲区数
6
jvm.threads.daemon
JVM守护线程数
是
显示在监控页面
7
jvm.threads.live
JVM当前活跃线程数
是
显示在监控页面;监控达到阈值时报警
重要
8
jvm.threads.peak
JVM峰值线程数
是
显示在监控页面
9
jvm.classes.loaded
加载classes数
10
jvm.classes.unloaded
未加载的classes数
11
jvm.gc.memory.allocated
GC时,年轻代分配的内存空间
12
jvm.gc.memory.promoted
GC时,老年代分配的内存空间
13
jvm.gc.max.data.size
GC时,老年代的最大内存空间
14
jvm.gc.live.data.size
FullGC时,老年代的内存空间
15
jvm.gc.pause
GC耗时
是
显示在监控页面
---
TOMCAT
---
16
tomcat.sessions.created
tomcat已创建session数
17
tomcat.sessions.expired
tomcat已过期session数
18
tomcat.sessions.active.current
tomcat活跃session数
19
tomcat.sessions.active.max
tomcat最多活跃session数
是
显示在监控页面,超过阈值可报警或者进行动态扩容
重要
20
tomcat.sessions.alive.max.second
tomcat最多活跃session数持续时间
21
tomcat.sessions.rejected
超过session最大配置后,拒绝的session个数
是
显示在监控页面,方便分析问题
22
tomcat.global.error
错误总数
是
显示在监控页面,方便分析问题
23
tomcat.global.sent
发送的字节数
24
tomcat.global.request.max
request最长时间
25
tomcat.global.request
全局request次数和时间
26
tomcat.global.received
全局received次数和时间
27
tomcat.servlet.request
servlet的请求次数和时间
28
tomcat.servlet.error
servlet发生错误总数
29
tomcat.servlet.request.max
servlet请求最长时间
30
tomcat.threads.busy
tomcat繁忙线程
是
显示在监控页面,据此检查是否有线程夯住
31
tomcat.threads.current
tomcat当前线程数(包括守护线程)
是
显示在监控页面
重要
32
tomcat.threads.config.max
tomcat配置的线程最大数
是
显示在监控页面
重要
33
tomcat.cache.access
tomcat读取缓存次数
34
tomcat.cache.hit
tomcat缓存命中次数
---
CPU...
---
35
system.cpu.count
CPU数量
36
system.load.average.1m
load average
是
超过阈值报警
重要
37
system.cpu.usage
系统CPU使用率
38
process.cpu.usage
当前进程CPU使用率
是
超过阈值报警
39
http.server.requests
http请求调用情况
是
显示10个请求量最大,耗时最长的URL;统计非200的请求量
重要
40
process.uptime
应用已运行时间
是
显示在监控页面
41
process.files.max
允许最大句柄数
是
配合当前打开句柄数使用
42
process.start.time
应用启动时间点
是
显示在监控页面
43
process.files.open
当前打开句柄数
是
监控文件句柄使用率,超过阈值后报警
重要
监控dashboard可使用grafana。
附录
SpringBoot1.x的metrics信息
{"mem":568029,
"mem.free":164376,
"processors":16,
"instance.uptime":223643888,
"uptime":223835542,
"systemload.average":0.18,
"heap.committed":415232,
"heap.init":419840,
"heap.used":250855,
"heap":415232,
"nonheap.committed":156480,
"nonheap.init":2496,
"nonheap.used":152797,
"nonheap":0,
"threads.peak":114,
"threads.daemon":99,
"threads.totalStarted":234,
"threads":113,
"classes":15474,
"classes.loaded":15474,
"classes.unloaded":0,
"gc.ps_scavenge.count":1808,
"gc.ps_scavenge.time":99224,
"gc.ps_marksweep.count":3,
"gc.ps_marksweep.time":5314
}
SpringBoot2.0的metrics信息
{"names":[
"jvm.memory.committed",
"http.server.requests",
"jvm.buffer.memory.used",
"jvm.gc.memory.allocated",
"tomcat.sessions.created",
"tomcat.sessions.expired",
"jvm.memory.used",
"tomcat.global.error",
"jvm.gc.max.data.size",
"system.cpu.count",
"jvm.memory.max",
"tomcat.global.sent",
"jvm.buffer.total.capacity",
"jvm.buffer.count",
"process.files.max",
"jvm.threads.daemon",
"process.start.time",
"tomcat.sessions.active.max",
"tomcat.global.request.max",
"jvm.gc.live.data.size",
"process.files.open",
"process.cpu.usage",
"tomcat.threads.current",
"tomcat.servlet.request",
"jvm.gc.pause",
"process.uptime",
"tomcat.threads.busy",
"system.load.average.1m",
"tomcat.cache.hit",
"tomcat.global.request",
"tomcat.servlet.error",
"tomcat.servlet.request.max",
"tomcat.cache.access",
"tomcat.sessions.active.current",
"system.cpu.usage",
"jvm.threads.live",
"jvm.classes.loaded",
"jvm.classes.unloaded",
"jvm.threads.peak",
"tomcat.threads.config.max",
"jvm.gc.memory.promoted",
"tomcat.sessions.rejected",
"tomcat.global.received",
"tomcat.sessions.alive.max"
]
}
SpringBoot2.0的metrics支持多tag,如:http://ip:port/demo-prometheus/actuator/metrics/jvm.memory.committed/
以上是 基于SpringBoot2.0+Actuatormetrics的监控 的全部内容, 来源链接: utcz.com/z/516266.html