top命令详解

top命令详解
作者:尹正杰
版权声明:原创作品,谢绝转载!否则将追究法律责任。
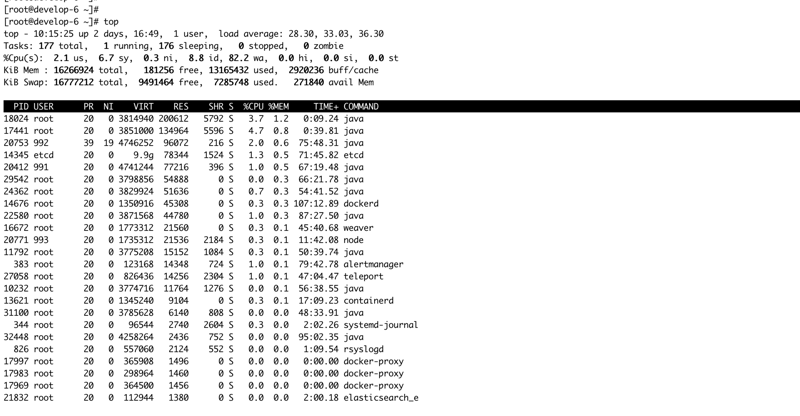
[root@node101.yinzhengjie.org.cn ~]# toptop
- 23:24:47 up 1:14, 3 users, load average: 0.00, 0.01, 0.03Tasks:
165 total, 1 running, 164 sleeping, 0stopped, 0 zombie #任务相关信息:从左到右依次是,总共进程数,正在运行到进程数,增在休眠到进程数,结束的进程数,僵尸进程数。%Cpu(s): 0.0 us, 0.2 sy, 0.0 ni, 99.8id, 0.0 wa, 0.0 hi, 0.0 si, 0.0 st #CPU相关信息:从做到有依次是,用户态,内核态,nice的优先级,cpu空闲,等待I/O,硬中断,软中断(切换模式),虚拟机偷走的时间(虚拟机CPU占用宿主机CPU百分比)。KiB Mem :
8007404 total, 7602968free, 114640 used, 289796 buff/cacheKiB Swap:
2064380 total, 2064380free, 0 used. 7678744 avail Mem PID USER PR NI VIRT RES SHR S
%CPU %MEM TIME+ COMMAND 4014 root 20014513651883908 S 0.30.10:00.88 sshd 1 root 2004637668404088 S 0.00.10:01.00 systemd 2 root 200000 S 0.00.00:00.00 kthreadd 3 root 200000 S 0.00.00:00.00 ksoftirqd/05 root 0 -20000 S 0.00.00:00.00 kworker/0:0H
7 root rt 0000 S 0.00.00:00.03 migration/0
8 root 200000 S 0.00.00:00.00 rcu_bh
9 root 200000 S 0.00.00:00.00 rcuob/0
10 root 200000 S 0.00.00:00.00 rcuob/1
11 root 200000 S 0.00.00:00.00 rcuob/2
12 root 200000 S 0.00.00:00.00 rcuob/3
13 root 200000 S 0.00.00:00.00 rcuob/4
14 root 200000 S 0.00.00:00.00 rcuob/5
15 root 200000 S 0.00.00:00.00 rcuob/6
16 root 200000 S 0.00.00:00.00 rcuob/7
17 root 200000 S 0.00.00:00.00 rcuob/8
18 root 200000 S 0.00.00:00.00 rcuob/9
19 root 200000 S 0.00.00:00.00 rcuob/10
20 root 200000 S 0.00.00:00.00 rcuob/11
21 root 200000 S 0.00.00:00.00 rcuob/12
22 root 200000 S 0.00.00:00.00 rcuob/13
23 root 200000 S 0.00.00:00.00 rcuob/14
24 root 200000 S 0.00.00:00.00 rcuob/15
25 root 200000 S 0.00.00:00.00 rcuob/16
26 root 200000 S 0.00.00:00.00 rcuob/17
27 root 200000 S 0.00.00:00.00 rcuob/18
28 root 200000 S 0.00.00:00.00 rcuob/19
29 root 200000 S 0.00.00:00.00 rcuob/20
30 root 200000 S 0.00.00:00.00 rcuob/21
31 root 200000 S 0.00.00:00.00 rcuob/22
32 root 200000 S 0.00.00:00.00 rcuob/23
33 root 200000 S 0.00.00:00.00 rcuob/24
34 root 200000 S 0.00.00:00.00 rcuob/25
35 root 200000 S 0.00.00:00.00 rcuob/26
36 root 200000 S 0.00.00:00.00 rcuob/27
37 root 200000 S 0.00.00:00.00 rcuob/28
38 root 200000 S 0.00.00:00.00 rcuob/29
39 root 200000 S 0.00.00:00.00 rcuob/30
40 root 200000 S 0.00.00:00.00 rcuob/31
41 root 200000 S 0.00.00:00.20 rcu_sched
42 root 200000 S 0.00.00:00.12 rcuos/0
43 root 200000 S 0.00.00:00.14 rcuos/1
44 root 200000 S 0.00.00:00.00 rcuos/2
45 root 200000 S 0.00.00:00.00 rcuos/3
46 root 200000 S 0.00.00:00.00 rcuos/4
47 root 200000 S 0.00.00:00.00 rcuos/5
48 root 200000 S 0.00.00:00.00 rcuos/6
49 root 200000 S 0.00.00:00.00 rcuos/7
50 root 200000 S 0.00.00:00.00 rcuos/8
51 root 200000 S 0.00.00:00.00 rcuos/9
[root@node101.yinzhengjie.org.cn ~]#
一.top有许多内置命令
排序: P:以占据的CPU百分比,
%CPU M:占据内存百分比,
%MEM T:累积占据CPU时长,TIME
+首部信息显示:
uptime信息:l命令
tasks及cpu信息:t命令
cpu分别显示:
1 (数字) memory信息:m命令
退出命令:q
修改刷新时间间隔:s
终止指定进程:k
保存文件:W
选项:
-d:
指定刷新时间间隔,默认为3秒
-b
全部显示所有进程
-n
刷新多少次后退出
-H
线程模式,示例:top -H -p `pidof mysqld`二.top每行相关参数说明
一.系统运行时间和平均负载1>.up 现实的是系统当前时间。(后面紧跟的参数是系统已经运行的时间)。
2>.users 当前登陆用户数量。
3>.load average 相应最近5、10和15分钟内的平均负载。
二.Tasks相关参数说明
1>.total 系统现在有进程数。
2>.running 处于运行中进程数据。
3>.sleeping 处于休眠状态的进程数。
4>.stopped 结束的进程数。
5>.zombie 僵尸的进程数。
三.CPU使用百分比相关参数说明
1>.us 用户空间所占CPU的百分比。运行(未调整优先级的) 用户进程的CPU时间
2>.sy 内核空间所占的CPU的百分比。 运行内核进程的CPU时间
3>.ni 进程的优先级为负数所占CPU的百分比。运行已调整优先级的用户进程的CPU时间
4>.id 空闲进程所占CPU的百分比。
5>.wa 等待IO所占CPU的百分比,用于等待IO完成的CPU时间。不是值不是说越大越好,对于IO密集型的集群来说,这个值偏大是很正常的,大家需要根据具体情况具体分析哟~
6>.hi 硬中断所占CPU的百分比,处理硬件中断的CPU时间。
7>.si 软中断所占CPU的百分比,处理软件中断的CPU时间。
8>st 虚拟机的CPU占用宿主机CPU的百分比。这个虚拟机被hypervisor偷去的CPU时间(译注:如果当前处于一个hypervisor下的vm,实际上hypervisor也是要消耗一部分CPU处理时间的)。
四.MEM内存相关参数说明
1>.tatal 物理内存总量。
2>.free 空闲内存总量。
3>.used 使用中的内存总量。
4>.buff/cache 缓存的内存量。
五.SWAP交换分区相关参数说明
1>.total 交换区总量。
2>.free 空闲交换区总量。
3>.used 使用的交换区总量。
4>.avail Mem 可用的交换区总量
六.各个进程(任务)的状态监控
1>.PID 进程的唯一ID编号,用于标识一个进程。
2>.USER 进程的所属者
3>.PR 进程的优先级级别,该值越小,优先级越高。进程的调度优先级。这个字段的一些值是
'rt'。这意味这这些进程运行在实时态。4>.NI 进程的nice值(优先级)。越小的值意味着越高的优先级。负值表示高优先级,正值表示低优先级。
5>.VIRT 进程使用的虚拟内存。进程使用的虚拟内存总量,单位kb。VIRT
=SWAP+RES6>.RES 驻留内存大小。驻留内存是任务使用的非交换物理内存大小。进程使用的、未被换出的物理内存大小,单位kb。RES
=CODE+DATA7>.SHR SHR是进程使用的共享内存。共享内存大小,单位kb.
8>.S 这个是进程的状态。它有以下不同的值:
D
- 不可中断的睡眠态。 R – 运行态
S – 睡眠态
T – 被跟踪或已停止
Z – 僵尸态
9>.%CPU 自从上一次更新时到现在任务所使用的CPU时间百分比。
10>.%MEM 进程使用的可用物理内存百分比。
11>.TIME+ 任务启动后到现在所使用的全部CPU时间,精确到百分之一秒。
12>.COMMAND 运行进程所使用的命令。进程名称(命令名
/命令行)三.htop命令(比top好用,需要安装相应的软件包)
1>.安装htop
[root@node101.yinzhengjie.org.cn ~]# yum -y install epel-releaseLoaded plugins: fastestmirror
Loading mirror speeds from cached hostfile
* base: mirrors.aliyun.com* epel: mirrors.tuna.tsinghua.edu.cn* extras: mirrors.aliyun.com* updates: mirrors.aliyun.comResolving Dependencies
--> Running transaction check---> Package epel-release.noarch 0:7-11 will be updated---> Package epel-release.noarch 0:7-12 will be an update--> Finished Dependency ResolutionDependencies Resolved
======================================================================================================================================= Package Arch Version Repository Size
=======================================================================================================================================Updating:
epel
-release noarch 7-12 epel 15 kTransaction Summary
=======================================================================================================================================Upgrade
1 PackageTotal download size:
15 kDownloading packages:
Delta RPMs disabled because
/usr/bin/applydeltarpm not installed.epel
-release-7-12.noarch.rpm | 15 kB 00:00:06Running transaction check
Running transaction test
Transaction test succeeded
Running transaction
Updating : epel
-release-7-12.noarch 1/2 Cleanup : epel
-release-7-11.noarch 2/2 Verifying : epel
-release-7-12.noarch 1/2 Verifying : epel
-release-7-11.noarch 2/2Updated:
epel
-release.noarch 0:7-12Complete
![root@node101.yinzhengjie.org.cn
~]#[root@node101.yinzhengjie.org.cn ~]# yum -y install epel-release
[root@node101.yinzhengjie.org.cn ~]# yum -y install htopLoaded plugins: fastestmirror
Loading mirror speeds from cached hostfile
epel
/x86_64/metalink | 5.9 kB 00:00:00 * base: mirrors.aliyun.com
* epel: mirrors.tuna.tsinghua.edu.cn
* extras: mirrors.aliyun.com
* updates: mirrors.aliyun.com
base | 3.6 kB 00:00:00
epel | 5.3 kB 00:00:00
extras | 2.9 kB 00:00:00
updates | 2.9 kB 00:00:00
(1/2): epel/x86_64/updateinfo | 1.0 MB 00:00:09
(2/2): epel/x86_64/primary_db | 6.9 MB 00:00:03
Resolving Dependencies
--> Running transaction check
---> Package htop.x86_64 0:2.2.0-3.el7 will be installed
--> Finished Dependency Resolution
Dependencies Resolved
=======================================================================================================================================
Package Arch Version Repository Size
=======================================================================================================================================
Installing:
htop x86_64 2.2.0-3.el7 epel 103 k
Transaction Summary
=======================================================================================================================================
Install 1 Package
Total download size: 103 k
Installed size: 218 k
Downloading packages:
htop-2.2.0-3.el7.x86_64.rpm | 103 kB 00:00:05
Running transaction check
Running transaction test
Transaction test succeeded
Running transaction
Installing : htop-2.2.0-3.el7.x86_64 1/1
Verifying : htop-2.2.0-3.el7.x86_64 1/1
Installed:
htop.x86_64 0:2.2.0-3.el7
Complete!
[root@node101.yinzhengjie.org.cn ~]#
[root@node101.yinzhengjie.org.cn ~]# yum -y install htop #依赖EPEL源
2>.htop使用
选项:
-d 指定延迟时间;
-u UserName: 仅显示指定用户的进程
-s COLUME: 以指定字段进行排序
子命令:
s:
跟踪选定进程的系统调用
l:
显示选定进程打开的文件列表
a:
将选定的进程绑定至某指定CPU核心
t:
显示进程树
以上是 top命令详解 的全部内容, 来源链接: utcz.com/z/510080.html