python字体显示问题?
from matplotlib import pyplot as pltfrom matplotlib import font_manager
x = ('碳酸饮料', '绿茶', '矿泉水', '果汁', '其他')
y = [6, 7, 6, 1, 2]
fonts = font_manager.FontProperties(fname="C:\Windows\Fonts\simkai.ttf")
plt.figure(figsize=(15, 7), dpi=80)
plt.barh(range(len(x)), y, color="r", height=0.2)
plt.yticks(range(len(x)), x, fontproperties=fonts)
plt.xticks(range(9))
plt.show()
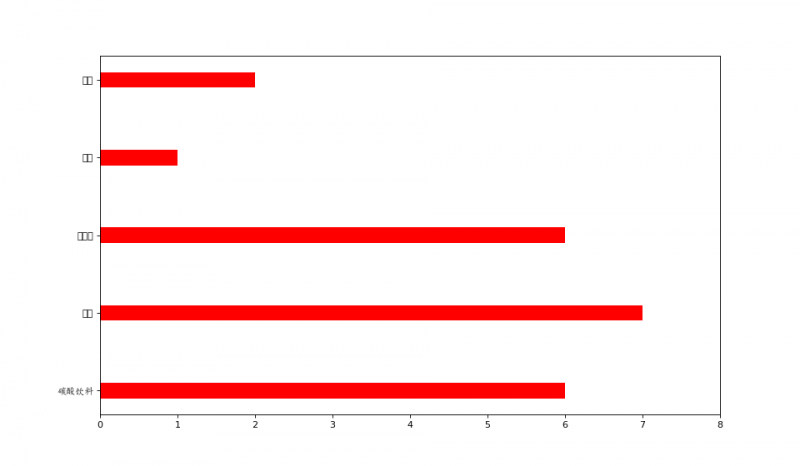
为什么图片纵坐标显示字体不全?
回答
试下下面的方法
from matplotlib import pyplot as pltplt.rcParams['font.sans-serif']=['KaiTi']
plt.rcParams['axes.unicode_minus']=False
x = ('碳酸饮料', '绿茶', '矿泉水', '果汁', '其他')
y = [6, 7, 6, 1, 2]
plt.figure(figsize=(15, 7), dpi=80)
plt.barh(range(len(x)), y, color="r", height=0.2)
plt.yticks(range(len(x)), x)
plt.xticks(range(9))
plt.show()
或者
from matplotlib import pyplot as pltx = ('碳酸饮料', '绿茶', '矿泉水', '果汁', '其他')
y = [6, 7, 6, 1, 2]
plt.figure(figsize=(15, 7), dpi=80)
plt.barh(range(len(x)), y, color="r", height=0.2)
yTuple=plt.yticks(range(len(x)), x)
plt.xticks(range(9))
yLabels = yTuple[1]
[label.set_fontname('KaiTi') for label in yLabels]
plt.show()
以上是 python字体显示问题? 的全部内容, 来源链接: utcz.com/a/43190.html